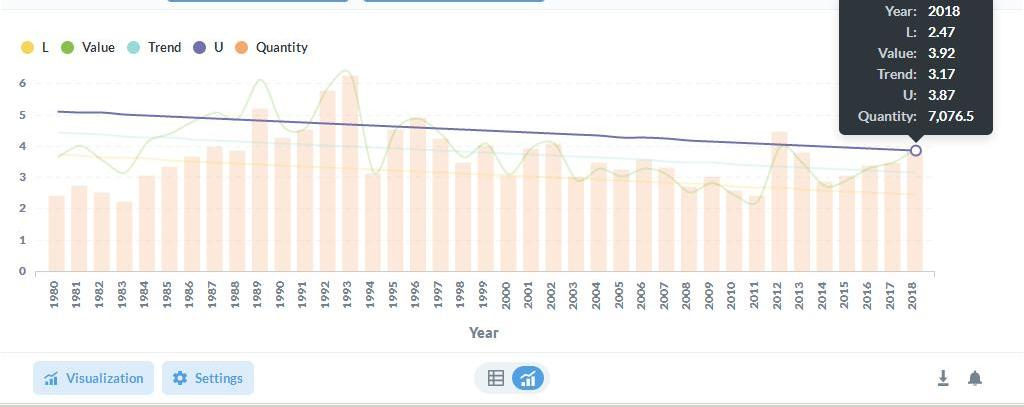
It seems that I am having a weird bug on visualization. As you can see from the graph below, I do have correct figures shown in the form, but not showing in any visualization. Can you please have a look? Thanks! @flamber Wondering if I am supposed to tag anyone but since you solved my problem perfectly last time, I will count on you, thanks a lot!
Hi @SteveFan
That is definitely a strange behavior - looks like a bug.
Looking at the data vs chart, they don’t quite correlate. So I’m unsure how the graph is being created, meaning which settings you have adjusted?
Is this a question via the interface or Native (SQL)?
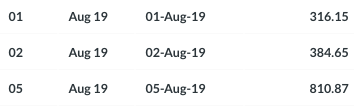
Could you supply just a couple of lines from the downloaded CSV-file, so I can try to reproduce the issue?
Hi @flamber
Thanks for the reply, it is native SQL.
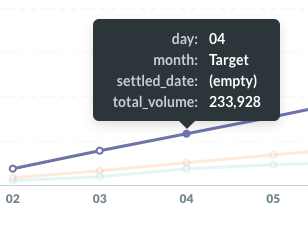
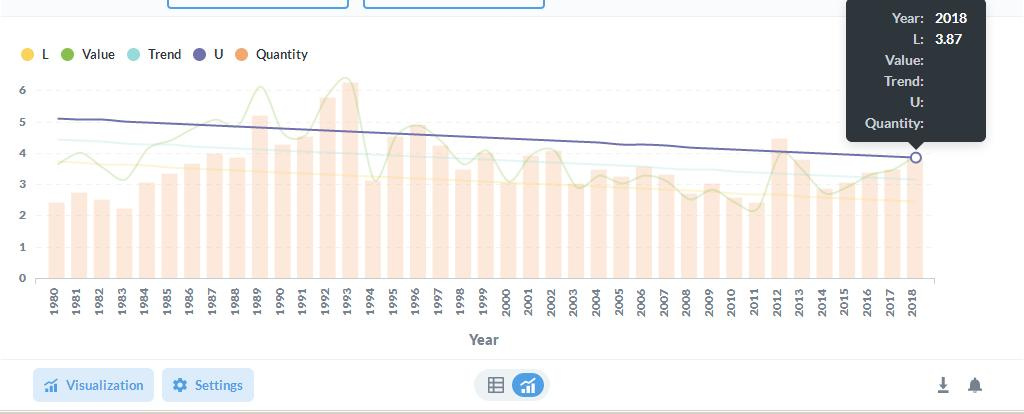
However, the problem is becoming weirder...see graph below?
Volume number appears, but settled_date becomes empty. Weird isn't?...
day
month
settled_date
total_volume
2
Sep-19
2-Sep-19
20785.89977
3
Sep-19
3-Sep-19
41810.73997
4
Sep-19
4-Sep-19
75836.96848
I have not found the attachment button, so I just copy this short piece of data here.
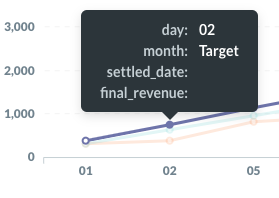
Except the real-time volume, I have also put Target and Budget like this:
@SteveFan
Hmm…now I’m getting a bit confused - it’s late and I have been playing with kids all day, so maybe I’m tired.
The chart image and the last line on the last table matches, so now I’m not sure what the problem is…?
There’s two issues currently, which might cause some strange behavior on 0.33.3 - issue #10840 and #10862 - and it seems like those issues are specific to data containing null values, but then it shouldn’t show the chart (from what I can gather from the issue reports).
Have you tried to see if you can reproduce the issue in any way from the Sample Dataset or with plain SQL queries - that would make a huge difference and much easier to debug and fix.
Hi @flamber
Thanks for reply, do not worry too much, just take a break and have a rest.
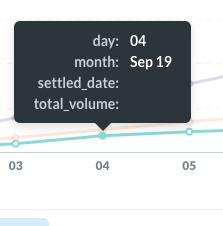
The issue seems very unstable, that appears suddenly and disappearing without me doing anything about it. See this:
The real data is actually still not shown on the graph, while the Target line was not showing in the morning and shows up right now.
I’m just going to ping @paulrosenzweig to see if he can see something I might be overlooking - he has been working on a lot of the recent fixes to many of the charts.
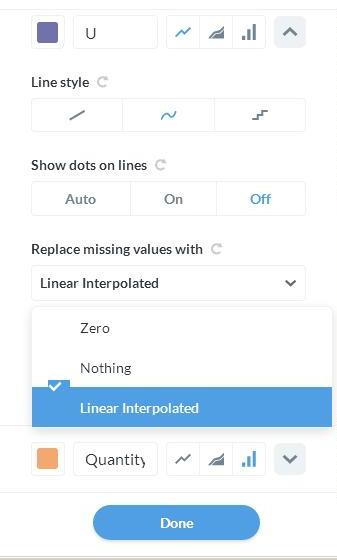
I think I have found the reason. It only appears when I set the Line Options “Replace missing values with” to “nothing”. As I changed it to “Linear interpolated” instead, the issue is gone.
Encountered the same problem and had a devil of a time getting the labels to fill with data again, the problem is definately a v0.33.4 bug!
Line chart labels drop their values entirely when the "replacing missing values" option is changed from the default Linear Interpolated to Zero or Nothing. Switched out the v0.33.3 metabase.jar file for v0.33.4 without first backing up the metabase.db.mv.db and metabase.db.trace.db files and going back to v0.33.3 shows the same problem (lesson learned, backup, backup, backup)! So whatever fixes were done in v0.33.4 to generate this bug also changes the other two files somehow. And they don't revert on their own if the jar file is switched out for that of v0.33.3 or v0.33.2, it takes going back to v0.33.1 before the other two files snap back for this feature. Switching the jar out again for v0.33.3 the feature is back, the labels fill with data as they should on the Zero or Nothing options.
Would appreciate somebody reproducing (any data will do, I'm using combo chart with native sql) with a dive into the code to shed some light on what's going on. GitHub issues #10862 and #10840 have allot of stuff going on in them, this would just get lost in that jumble. Perhaps it would helpful to open up a bug issue just for this, it's probably just some stray line of code somewhere from the many v0.33.4 fixes that can be patched to bring it back to the way it was before the changes.