Hi, there!
About the combo in visualization, would that be possible to add more (different) types of chart?
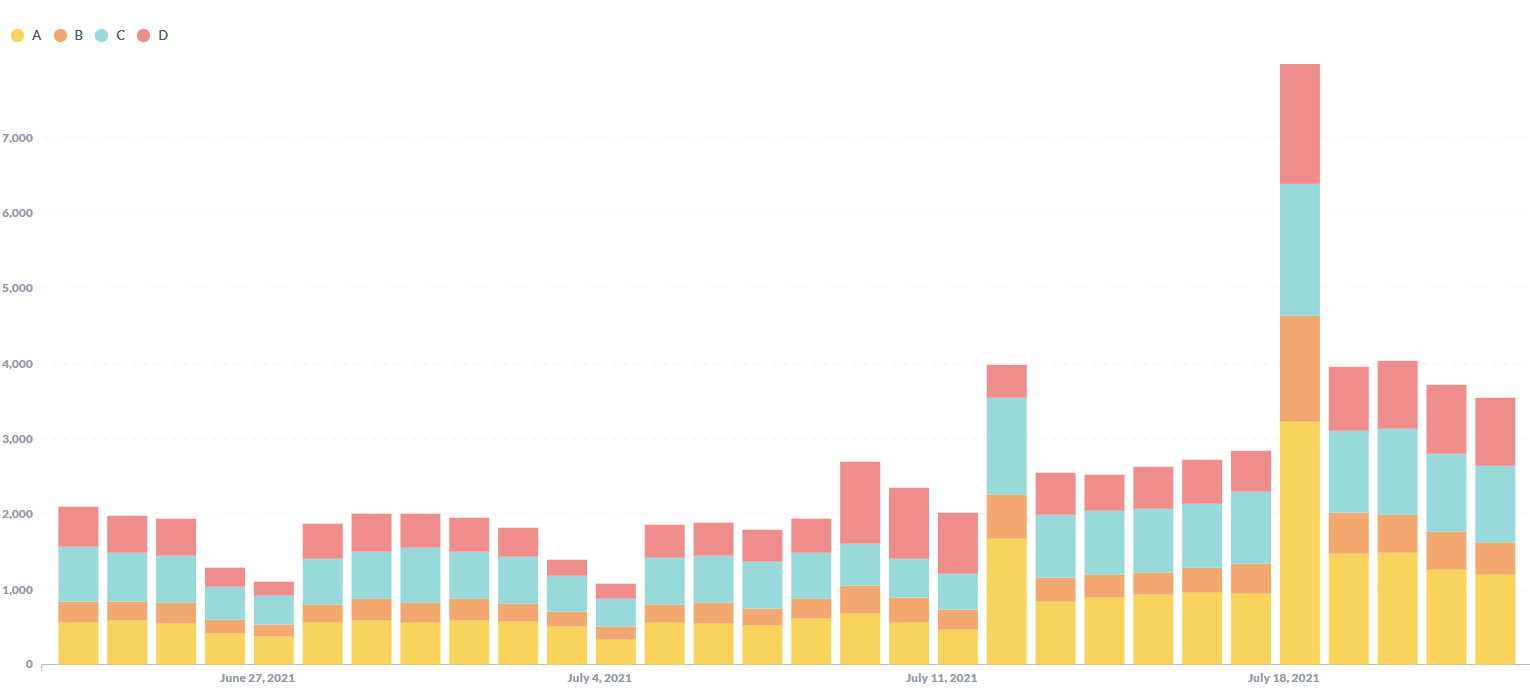
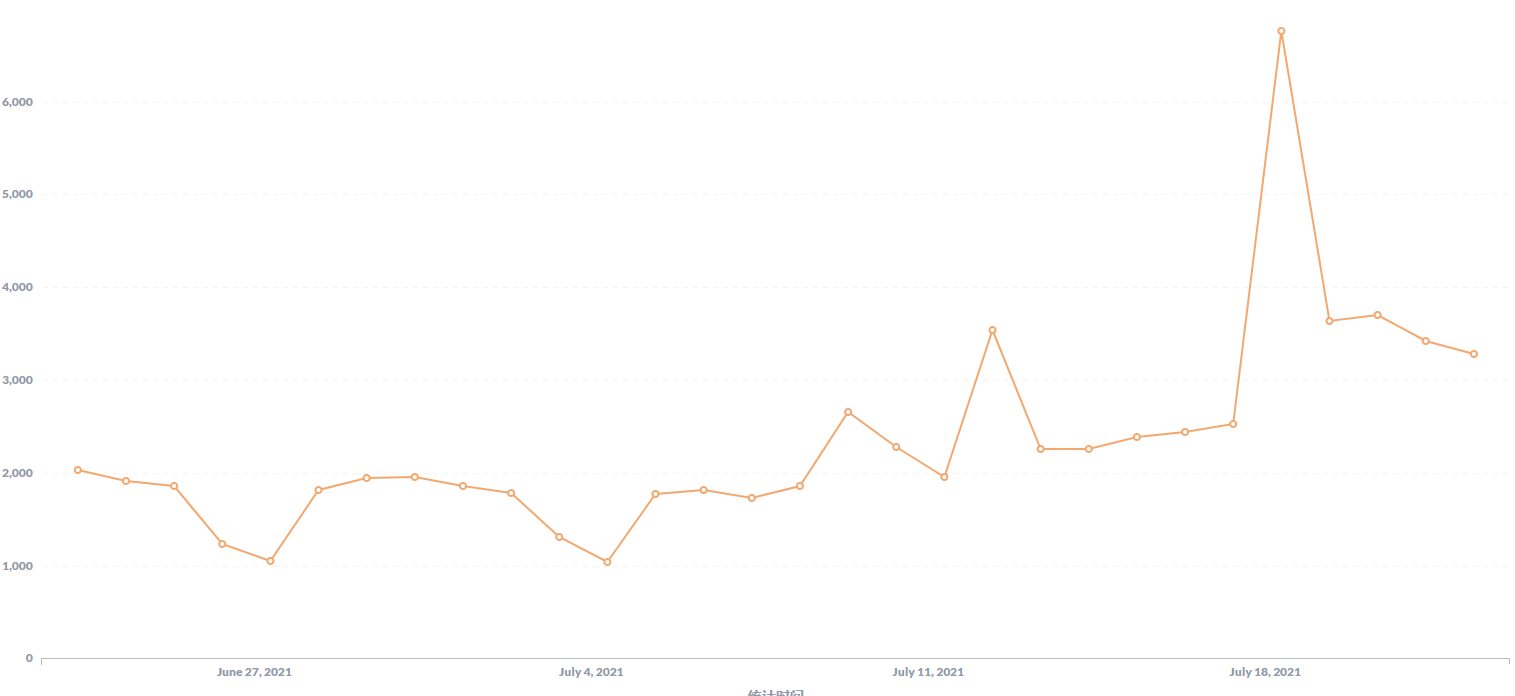
Say the result of qurey includes total and subdivision values, like the graphics below shows total = a+b+c+d, and we would appreciate that two visulaztions come into one visulaztion.
 on the first post