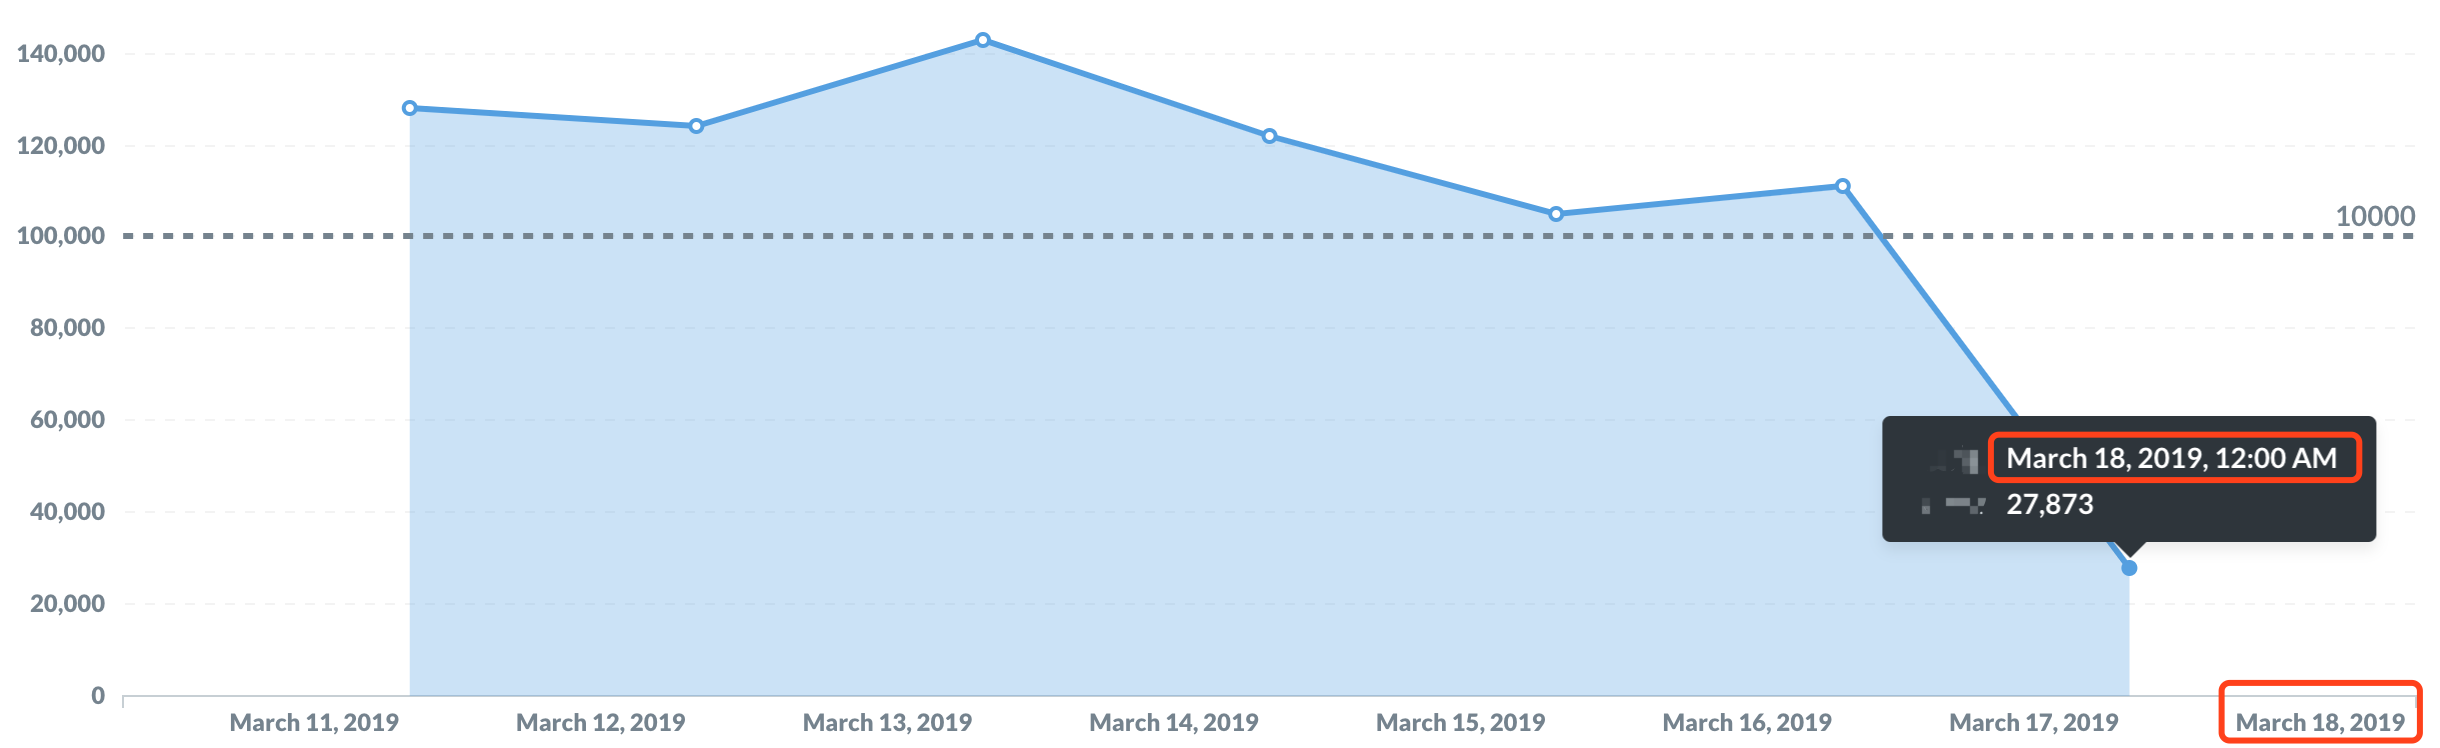
I queried the 7-day data, why the x-axis shows 8 scales, and the data and coordinate scales are not aligned, and the date format cannot be adjusted manually,because the length of the date is too long.
Hi @beta
That’s usually a problem with timezones. Have a look at the troubleshooting guide:
https://www.metabase.com/docs/latest/troubleshooting-guide/timezones.html
I set the time zone, it still doesn't work. Below is the table of data I found. It turns into 8 dates when I convert it into a line chart.
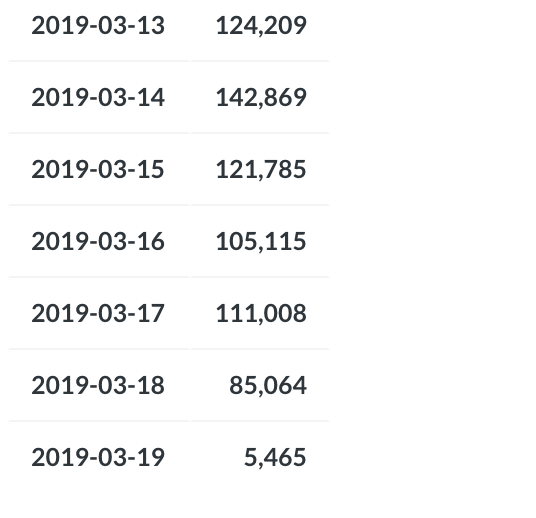
It’s a little difficult to help, when the graph and table contains different data.
Which version of Metabase and which database are you connecting to?
Are you using timeseries or ordinal as graph x-axis display?
The difference between the date in hover and x-axis - if it is not a timezone issue - could be:
https://github.com/metabase/metabase/issues/4245
https://github.com/metabase/metabase/issues/5246
I think the “extra” scale is a visually defect that probably comes from the previous issue.