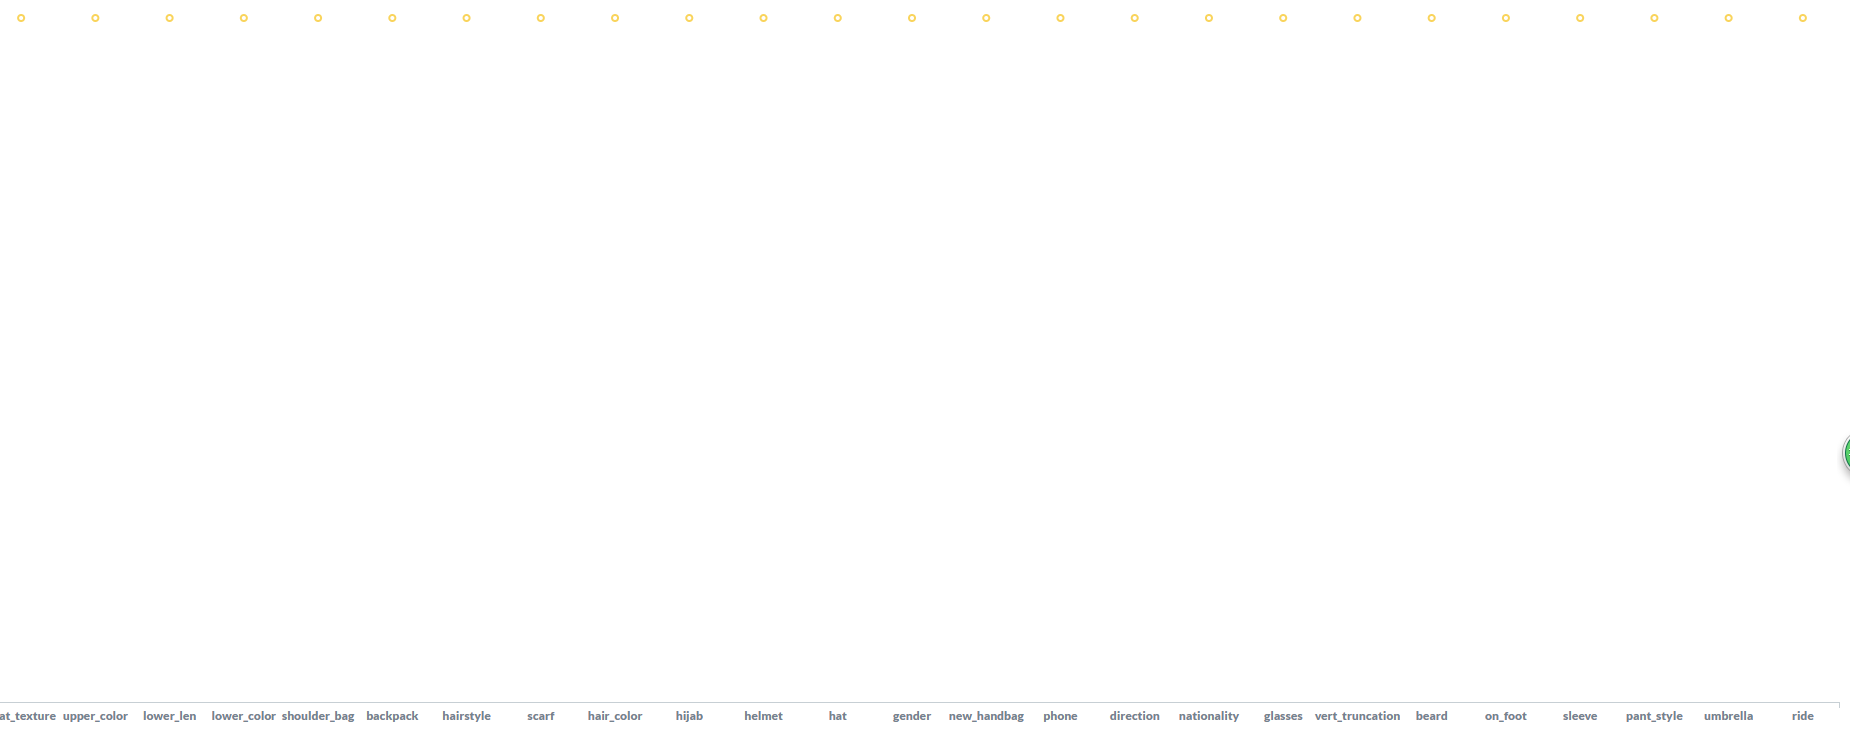
After filtering the fields for visual presentation, using a line chart, but the ordinate shows a horizontal row of dots on the top, and there is no change in the line.
Hi @sugar
Post “Diagnostic Info” from Admin > Troubleshooting.
What are you expecting to see?
Can you reproduce with Sample Dataset?
After the horizontal and vertical coordinates are set in the visualization chart, the data values of the horizontal and vertical coordinates cannot be displayed, only a row of dots on the horizontal line, clicking the dot can display the specific parameters of each point.
I don’t know how the top horizontal line came from, and the data is not connected into a broken line, and the data
shows scattered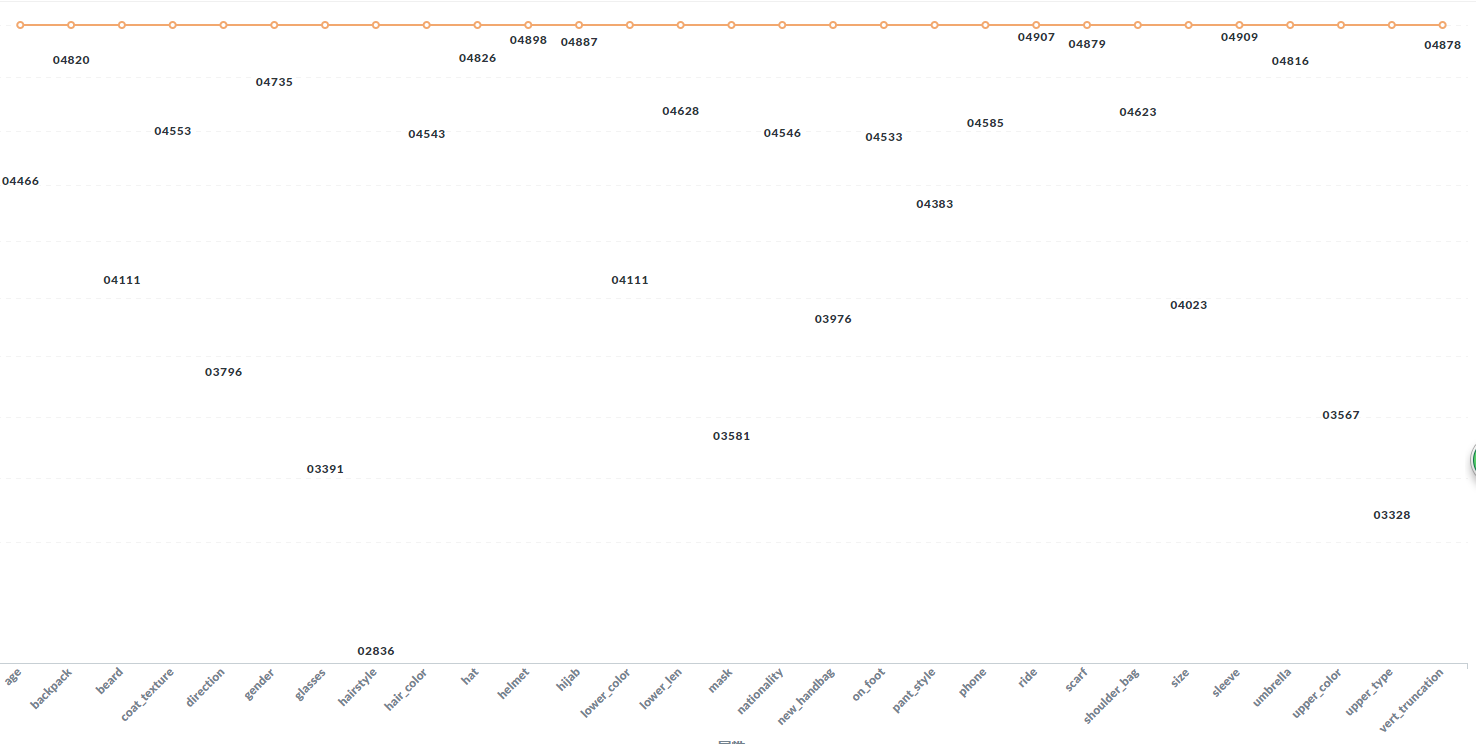
@sugar Post “Diagnostic Info” from Admin > Troubleshooting.
How can I check the log? There are too many and I don’t know where the problem is?
@sugar Post Diagnostic Info - not the log.