Unsure what's going on and how to fix this bug? I tried to use the builder but was unsure how to add multiple columns and divide by 100.
Bar Graph:
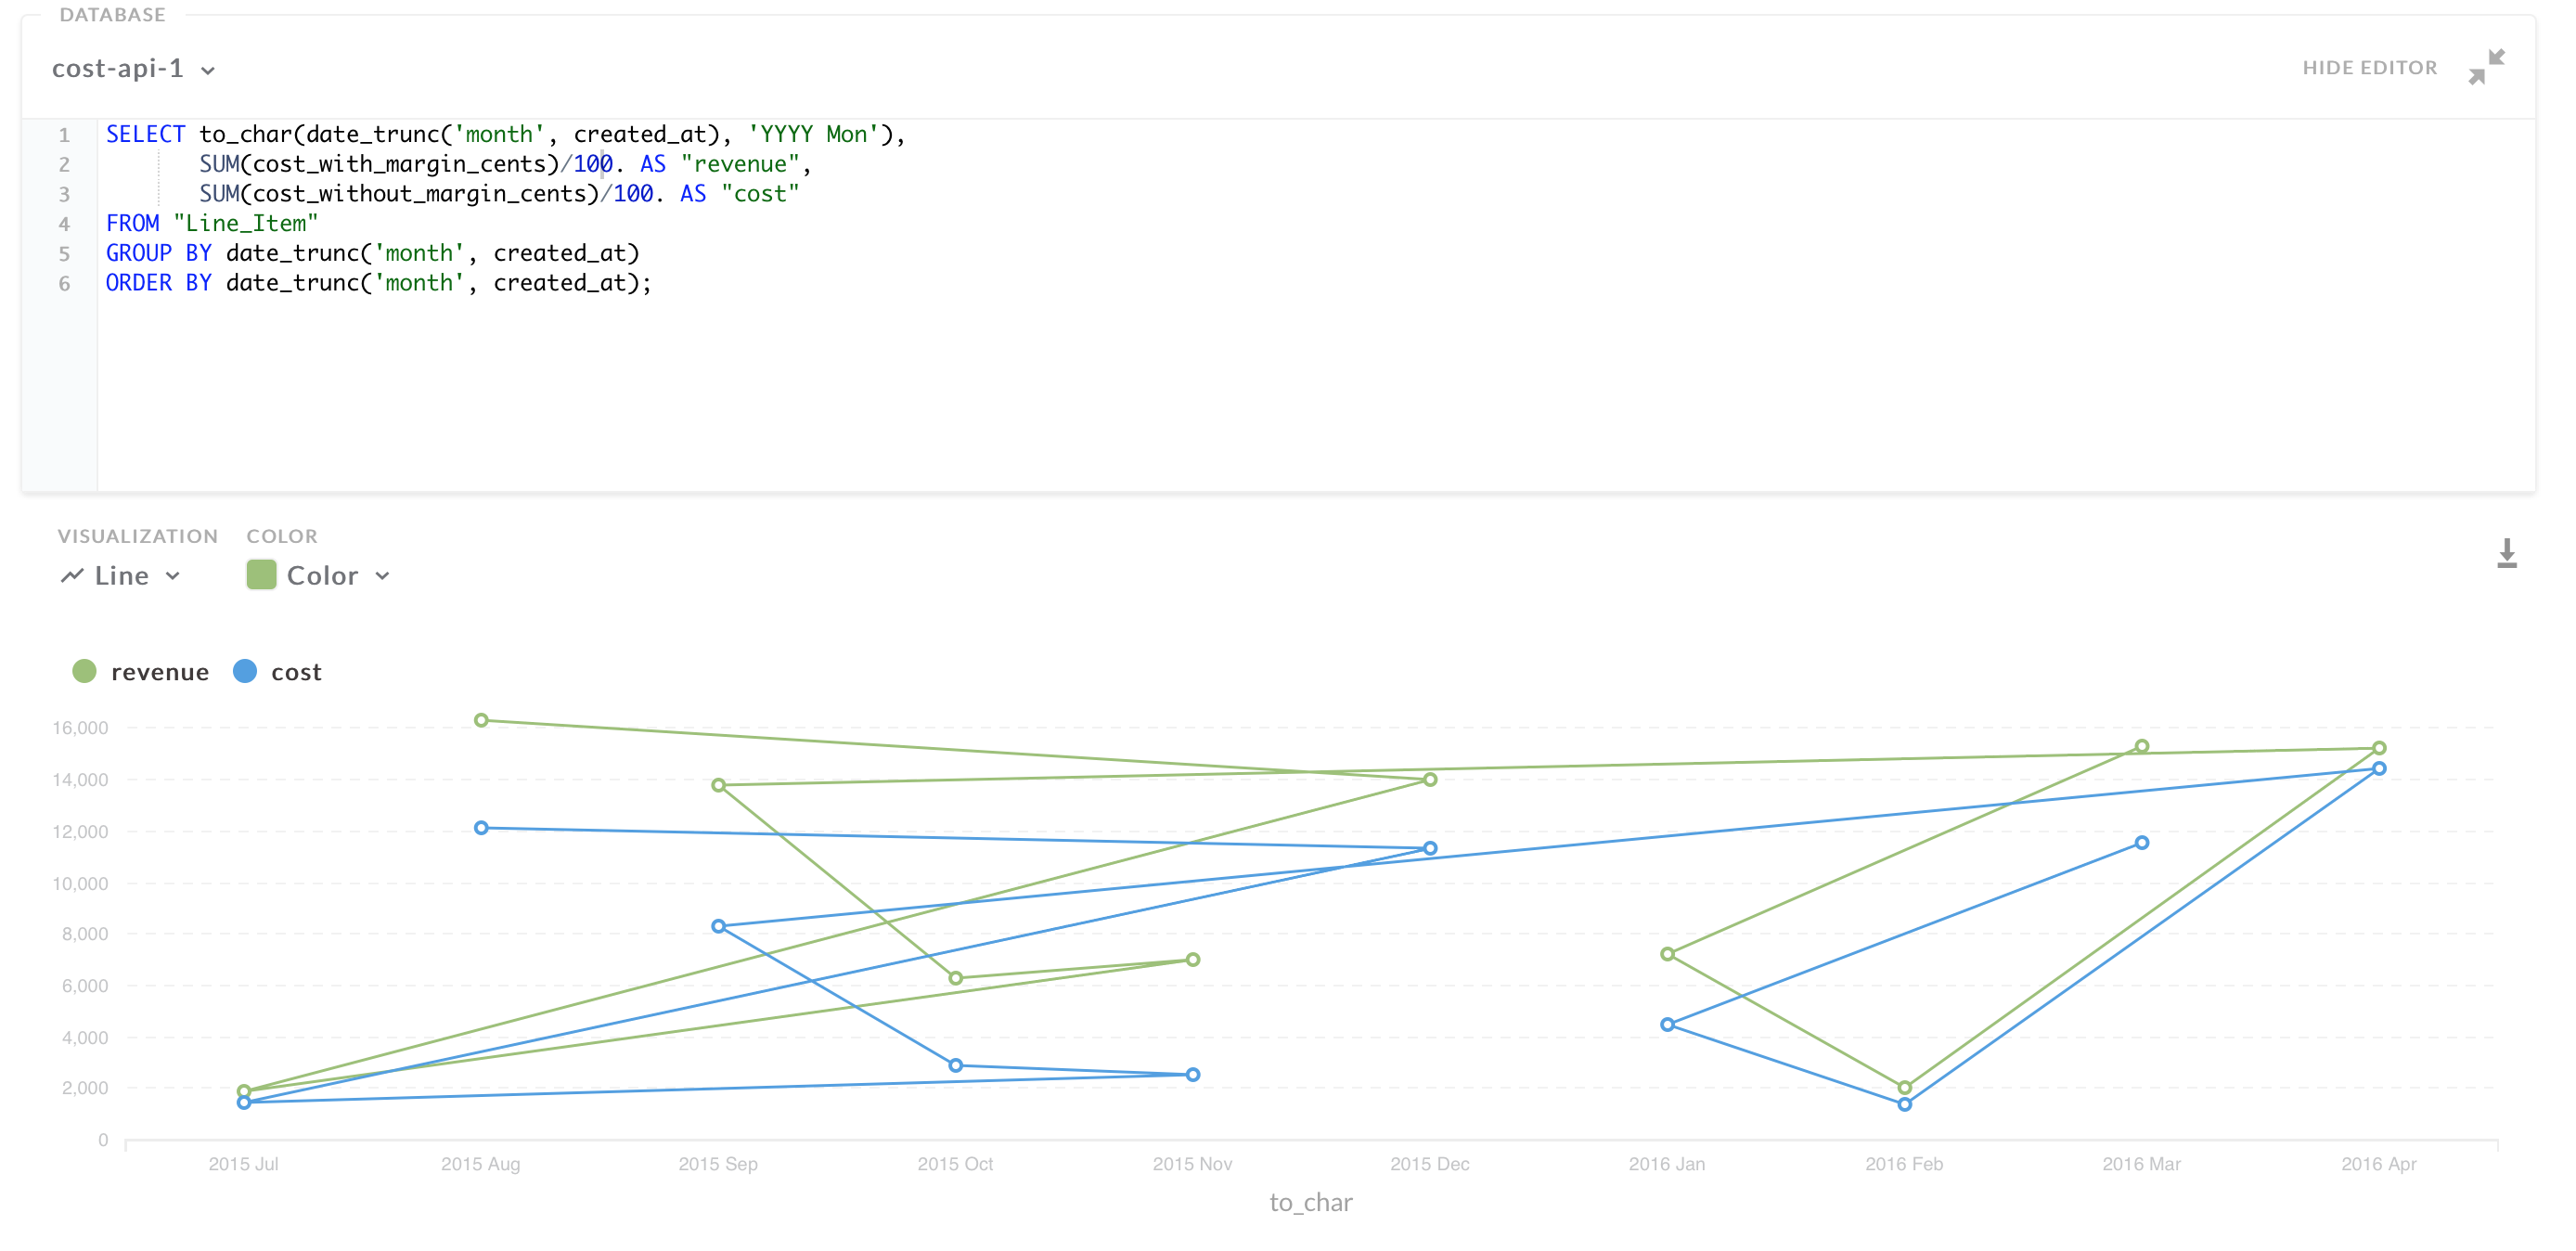
Unsure what's going on and how to fix this bug? I tried to use the builder but was unsure how to add multiple columns and divide by 100.
Bar Graph:
you need to provide an order statement. your sql returns the rows in arbitrary order
There is an ORDER statement.
Oh, you’re right.
What do the truncated datetime strings look like?
Also, can you let us know which database you’re using and the metabase version?
Postgres, Metabase 0.16.1.0
date_trunc: Saturday, August 1, 2015 12:00 AM
I realized the issue was with to_char in the SELECT statement.
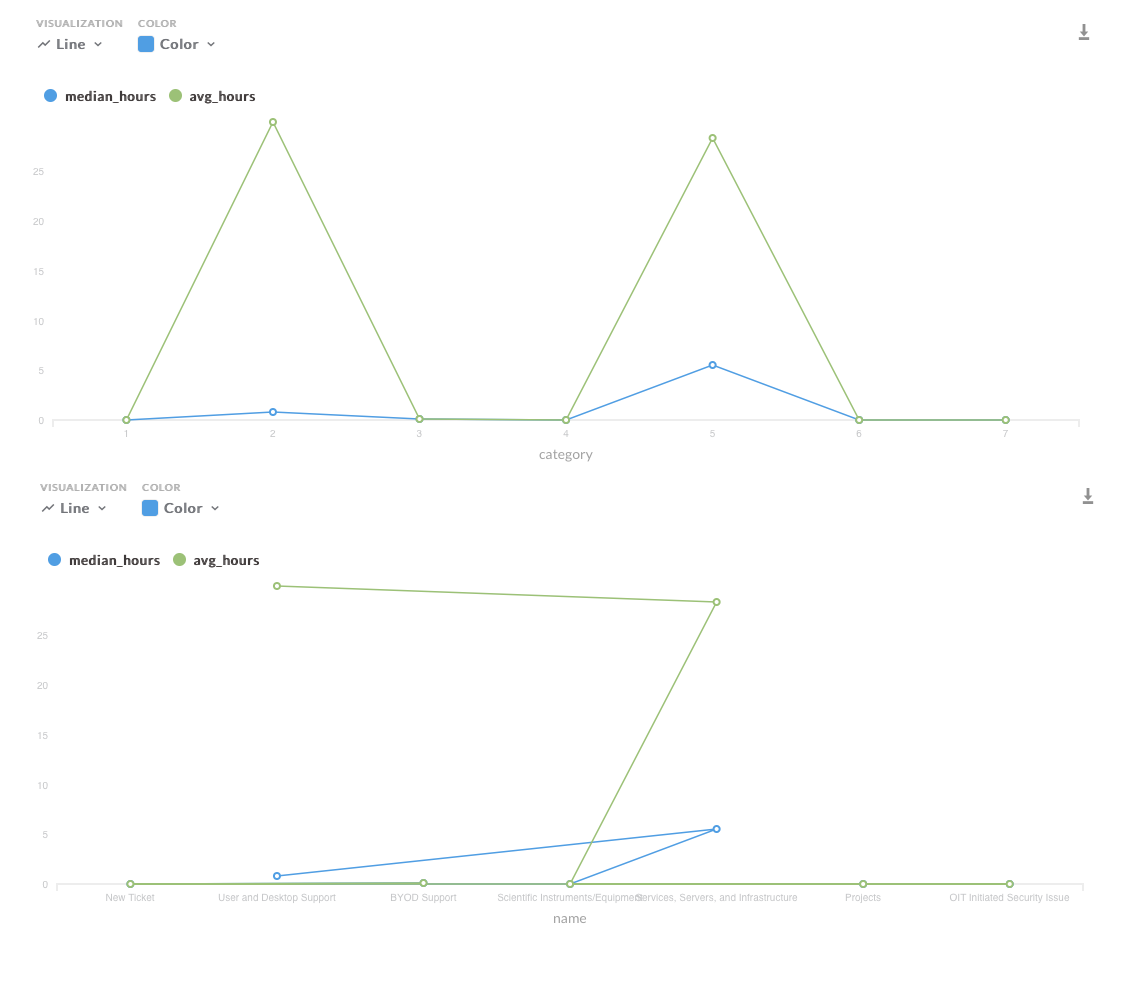
I not sure that this issue is limited to the to_char in the SELECT statement. I am seeing the same symptom on some of my reports. I am running a query based on a category ID which is numbered 1, 2, 3, etc. I also join it so that the chart shows the name of the category rather than just the ID. It appears that the chart is drawing the lines based on alphabetical order of the name rather than the order of the query which is by category ID.
I’m having to build the query via stored procedure. I will do some more testing to see if my suspicion is correct and post back. At the very least I can post the output table and graph.
The suspicion seems to be correct. Here are the screenshots. This is essentially the same data fields and order.
I can only put one image in a post so it will be spread over 4 posts.
Table using category ID
Update: I've updated the images to capture all info. This image is the tables, one using the category ID and the other using the category name via the join.