Why can't you use a line chart when visualizing

sql:
SELECT
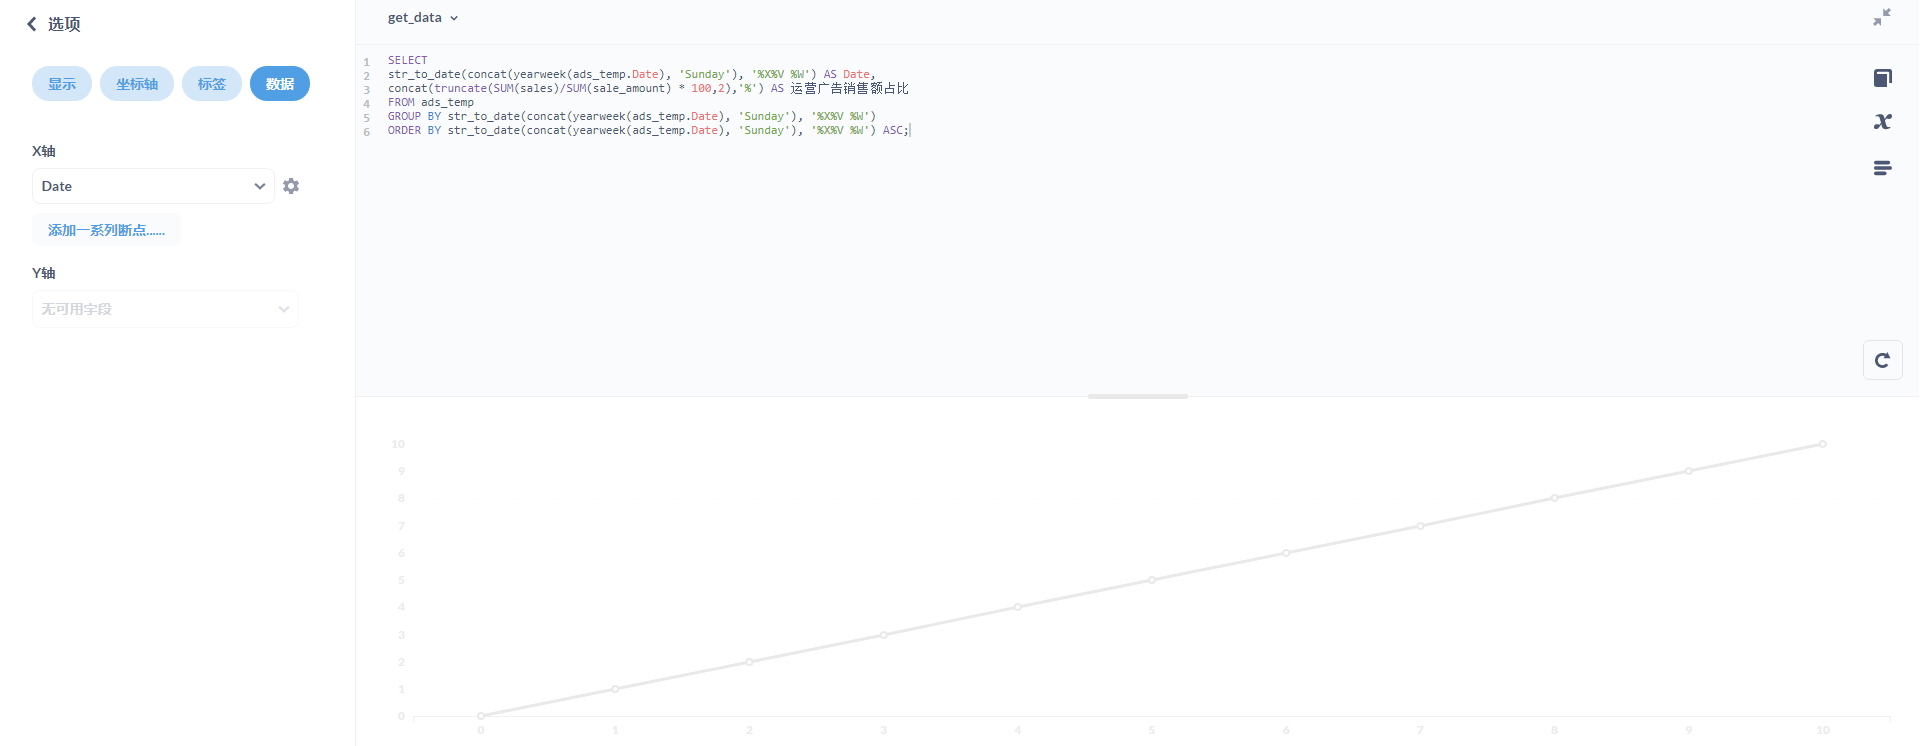
str_to_date(concat(yearweek(ads_temp.Date), 'Sunday'), '%X%V %W') AS Date,
concat(truncate(SUM(sales)/SUM(sale_amount) * 100,2),'%') AS 运营广告销售额占比
FROM ads_temp
GROUP BY str_to_date(concat(yearweek(ads_temp.Date), 'Sunday'), '%X%V %W')
ORDER BY str_to_date(concat(yearweek(ads_temp.Date), 'Sunday'), '%X%V %W') ASC;

Problem description:
The line chart cannot be selected for visualization. It is gray, and the average value column is percentage

image

Hi @elleryliang

Post "Diagnostic Info" from Admin > Troubleshooting.

While the visualization types are greyed out, you can still select them.

But it's because you are returning a string as percentage instead of a numeric value.

After the line chart is selected, the x-axis can select the time, and the y-axis displays: no field available

@elleryliang Again, return a numeric value instead of a string percentage. Do this instead:
SUM(sales)/SUM(sale_amount) AS 运营广告销售额占比
And apply formatting to the field:
https://www.metabase.com/docs/latest/users-guide/05-visualizing-results.html#column-formatting-options

I know this method, but I must ensure that the data of this line chart is a percentage, because I want to add this chart to another line chart. As the data is updated, the percentage will jump to the decimal point

@elleryliang I don't understand what you mean, but:

  1. Post "Diagnostic Info" from Admin > Troubleshooting
  2. Metabase does not support Y-axis made of strings.