Wrong total in pie chart

Hello,

I've some data that show count of distinct values grouped by Unidade - Distinct([Atendente]). Like that:

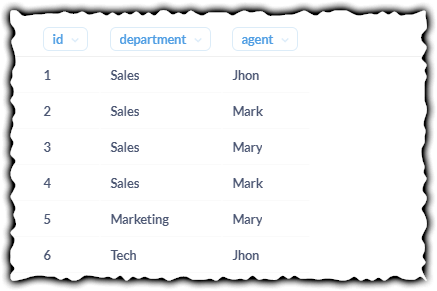
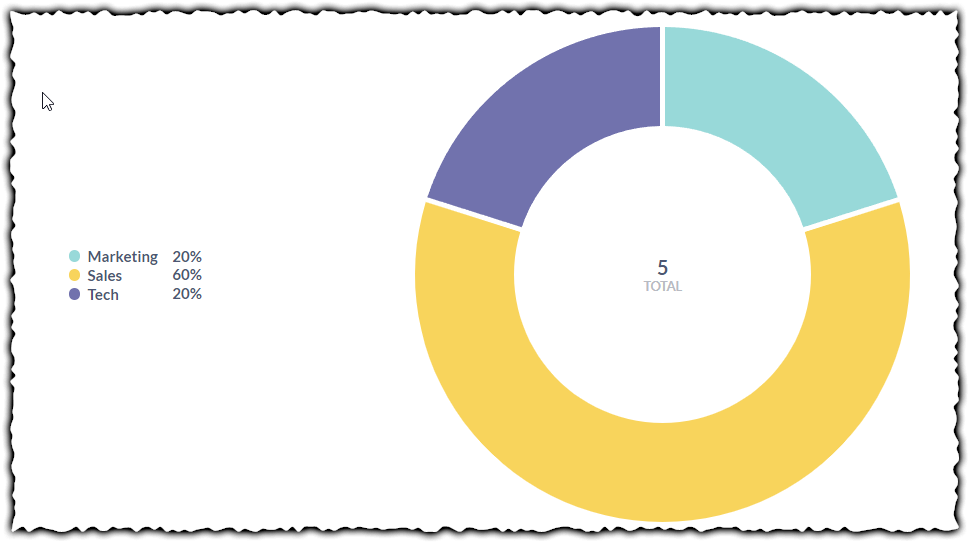
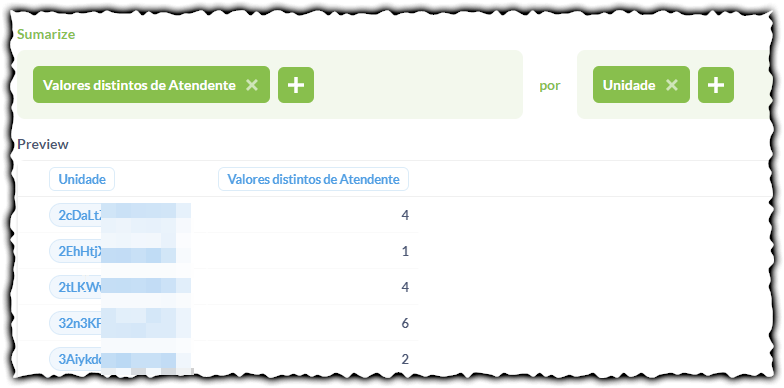
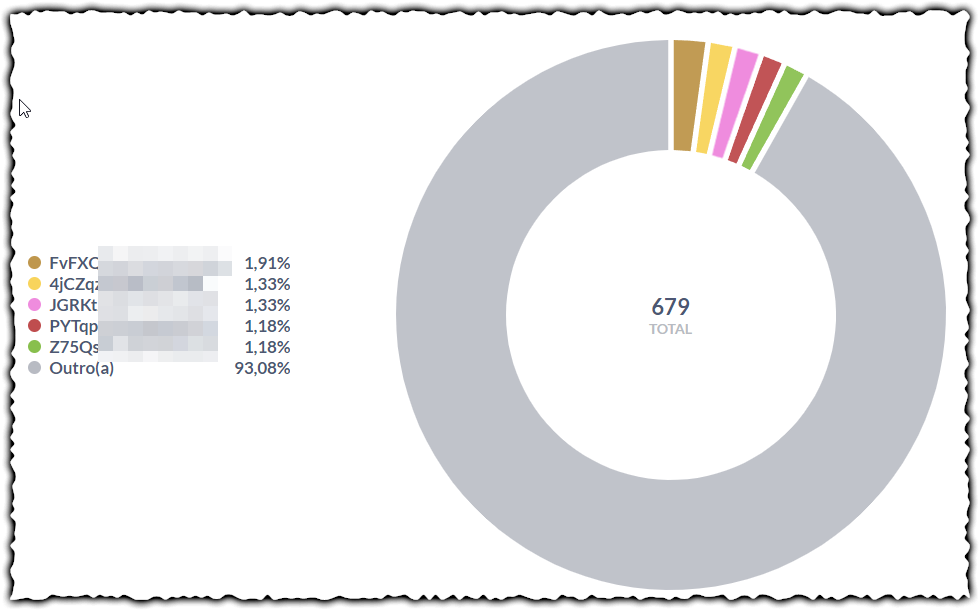
When I generate a pie chart from this the total result is wrong because pie just sum the value of each line. When the correct is apply Distinct([Atendente]) without grouping to show the realy total without repetitions.

When I use a pivot table it works like expected
image

Hi @trialsin
The bug is in Pivot Table, not in the Pie Chart:
https://github.com/metabase/metabase/issues/19373 - upvote by clicking :+1: on the first post

Huh! I think there is some misunderstanding...

Realize some service data like that:

image

A Agent can be in more than one Department like Mary that works in Marketing and Sales

if I want the number of agents that have attended by department I wil do Distinct([agent]) grouped by department

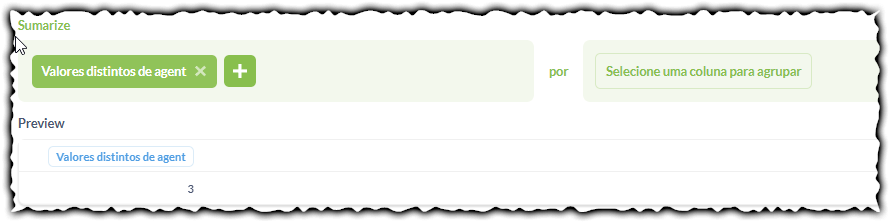
If I want the total of agents that have attended I can NOT just sum the result of each department. The correct is Distinct([agent]) without grouping like that:

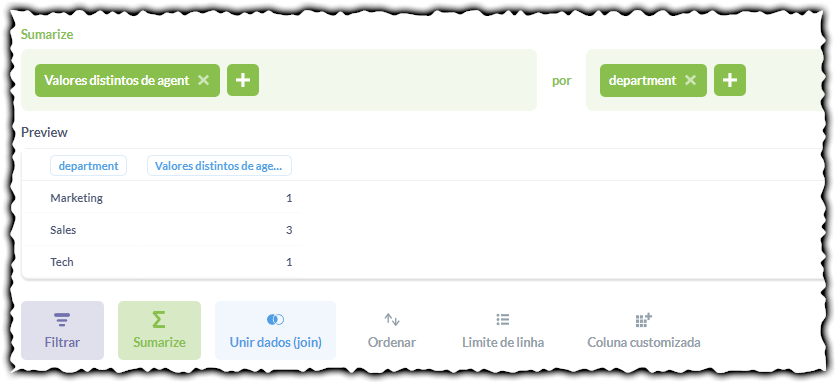
So, the Pie chart just sum the value of each group not obeying the aggregation function Distinct([agent]) - I have just 3 agents (Mary, Mark and Jhon) and not 5

But Pivot Table obey the aggregation function showing correct values

image

@trialsin No, it's the other way around. Pivot Table is incorrect. It should display 5.
If you want number of distinct agents, then don't group by agent, or just use count if you group.

It don't make sense to me.

I'm not grouping by Agent, I'm grouping by Department and counting distinct number of Agents

@trialsin Okay, please reproduce with Sample Dataset and create an issue with full description:
https://github.com/metabase/metabase/issues/new/choose