Hey everyone,
I'm trying to get used to metabase. I decided to graph out some data with a bar chart.
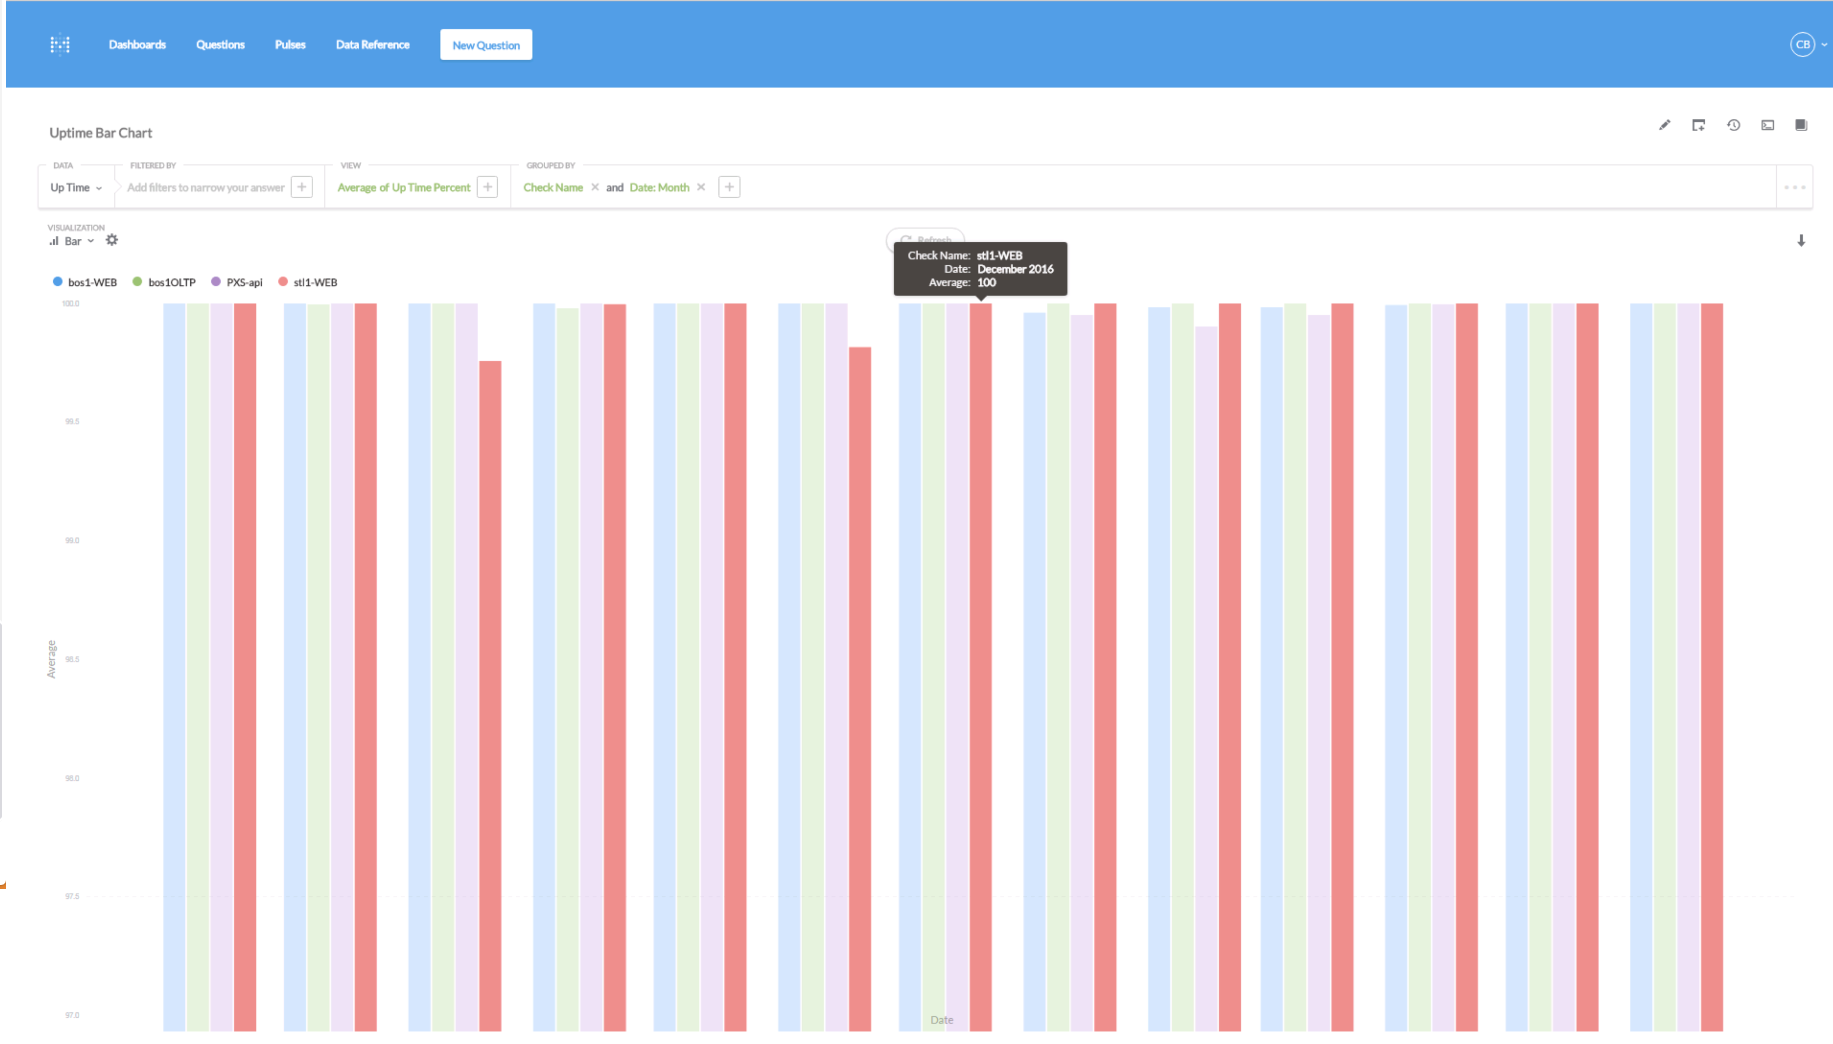
Since my data is very close in value (most is between 100 and 99.5) I needed to set the min value on the chart.
When I did this, the bars began to "continue" past the x-axis and cover it up. This makes it essentially impossible to see the x-axis.
Can anyone give me a hand?
Here is what I see -
Thanks!
-Cody