Hello,
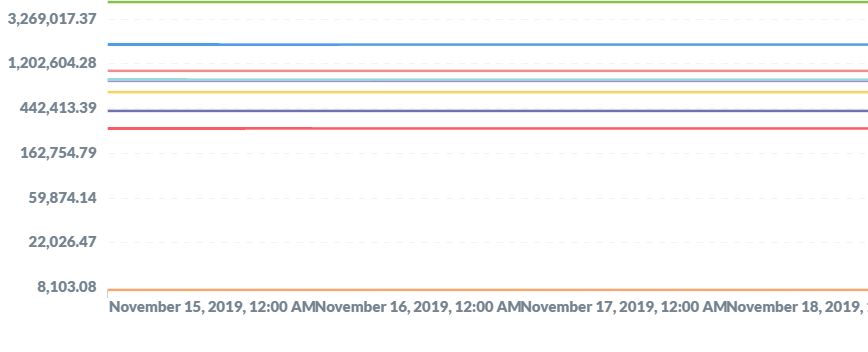
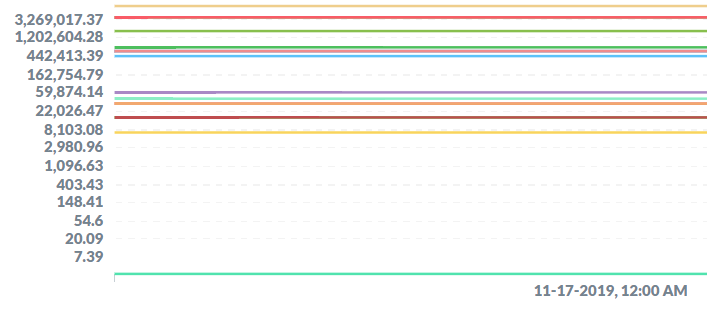
When using an iframe, the x-axis is getting messed up, is there any workaround for this? It looks perfectly fine in the normal dashboard.
Hello,
When using an iframe, the x-axis is getting messed up, is there any workaround for this? It looks perfectly fine in the normal dashboard.
Hi @kjkrupal
Which version of Metabase?
Which browser?
What is the size of the iframe?
Can you reproduce this with Sample Dataset? It will make it much easier to figure out what’s going wrong and to fix.
Hi @flamber, I am using 0.33.6. Browser is chrome. iframe width is 100%
@kjkrupal Okay, I cannot reproduce.
What resolution are you using? And which OS? And what’s the pixel width, where the iframe is embedded?