Hi
Having some problems. On my line graph, I'm trying to track Bitcoin price over time. In my database, there is new data loaded in every 5 minutes.
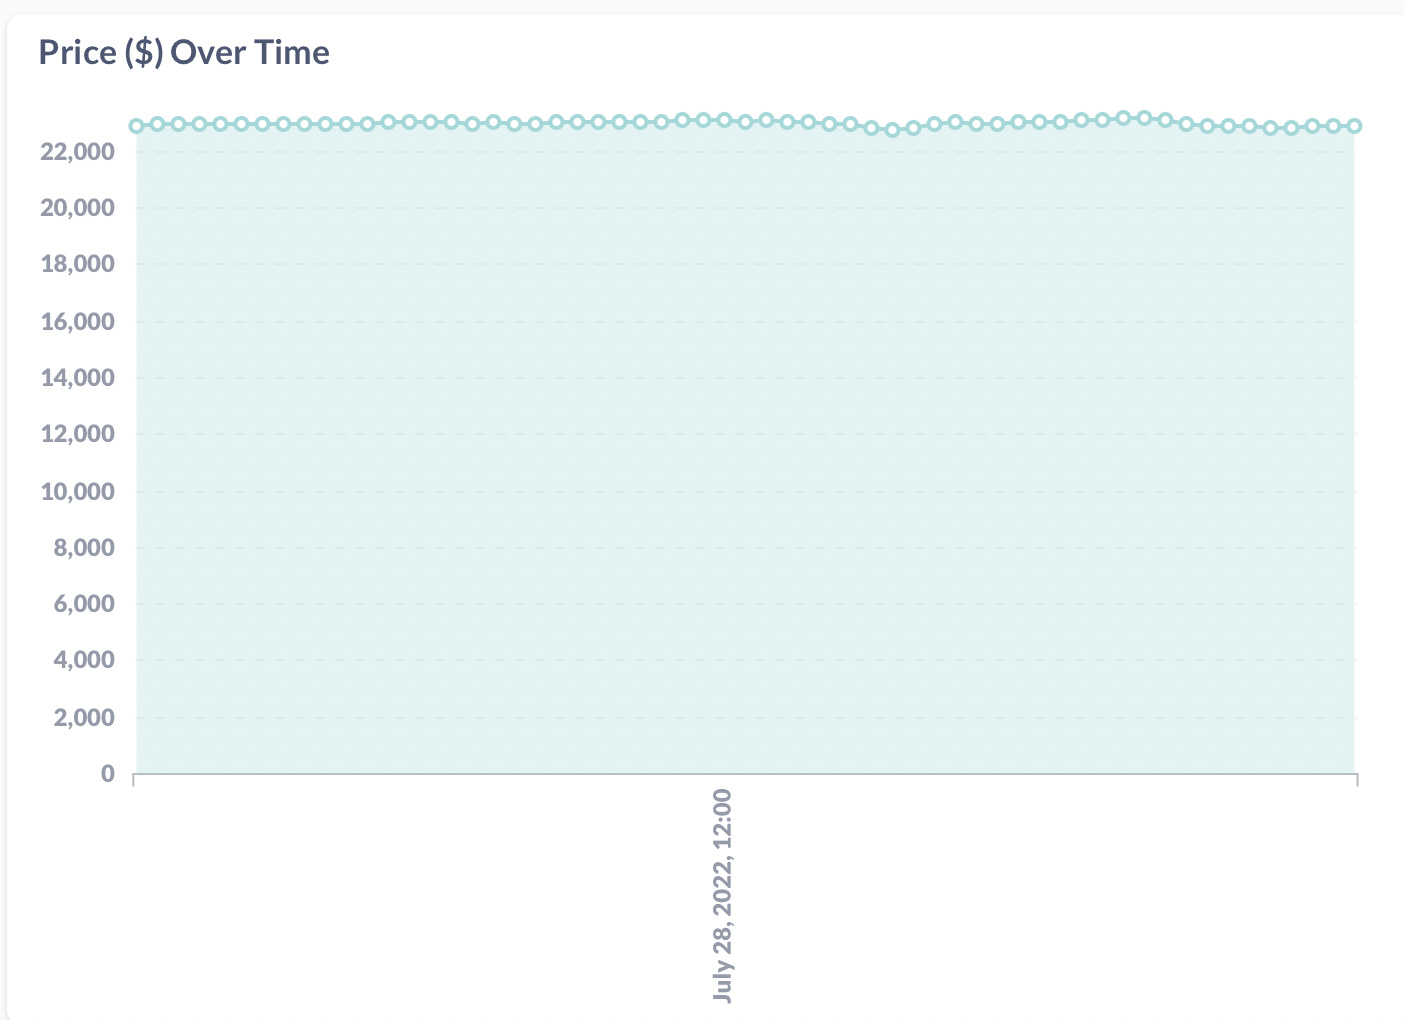
However, you can see that when I create the graph, the y-axis starts at 0, with the actual price of Bitcoin all the way at the top.
I'm looking for an option that will automatically zoom in on the line, or something like that. I don't want to hard code the y-axis values, as I may want to filter the graph to show values for a different coin, or it may be that bitcoin goes beyond the max y value I set.
Hi @AbzAaron
There's currently no setting to do it automatically. You can set the min/max Y-axis value to 23000 (instead of Auto y-axis range), which should do what you want.
https://www.metabase.com/docs/latest/users-guide/05-visualizing-results.html#options-for-line-bar-and-area-charts
You are looking for this feature:
https://github.com/metabase/metabase/issues/7196 - upvote by clicking  on the first post
1 Like
Thanks! Setting it to 23000. For now, I've just split each crypto into different graphs, and manually set the Y-axis. Not ideal but seems to work for now.