In the documentation, we are shown a demo on how to make PoP comparison, i.e. look at MoM growth.
But, what if on top of the MoM comparison, we also wanted to see the performance vs average?
For clarity lets say we have monthly data. Assume current month is January 2026 i want to compare
- Look at MoM Growth i.e. Jan 2026 vs December 2025
- Look at Monthly average of 2025 vs Jan 2026
Are you trying to achieve something like this?
To incorporate a monthly average, either calculate it in a separate question and join it to your base question (which is what I did here), or use a SQL query with a window function. If you’re joining the questions, join on the dates binned by “Month of year.”
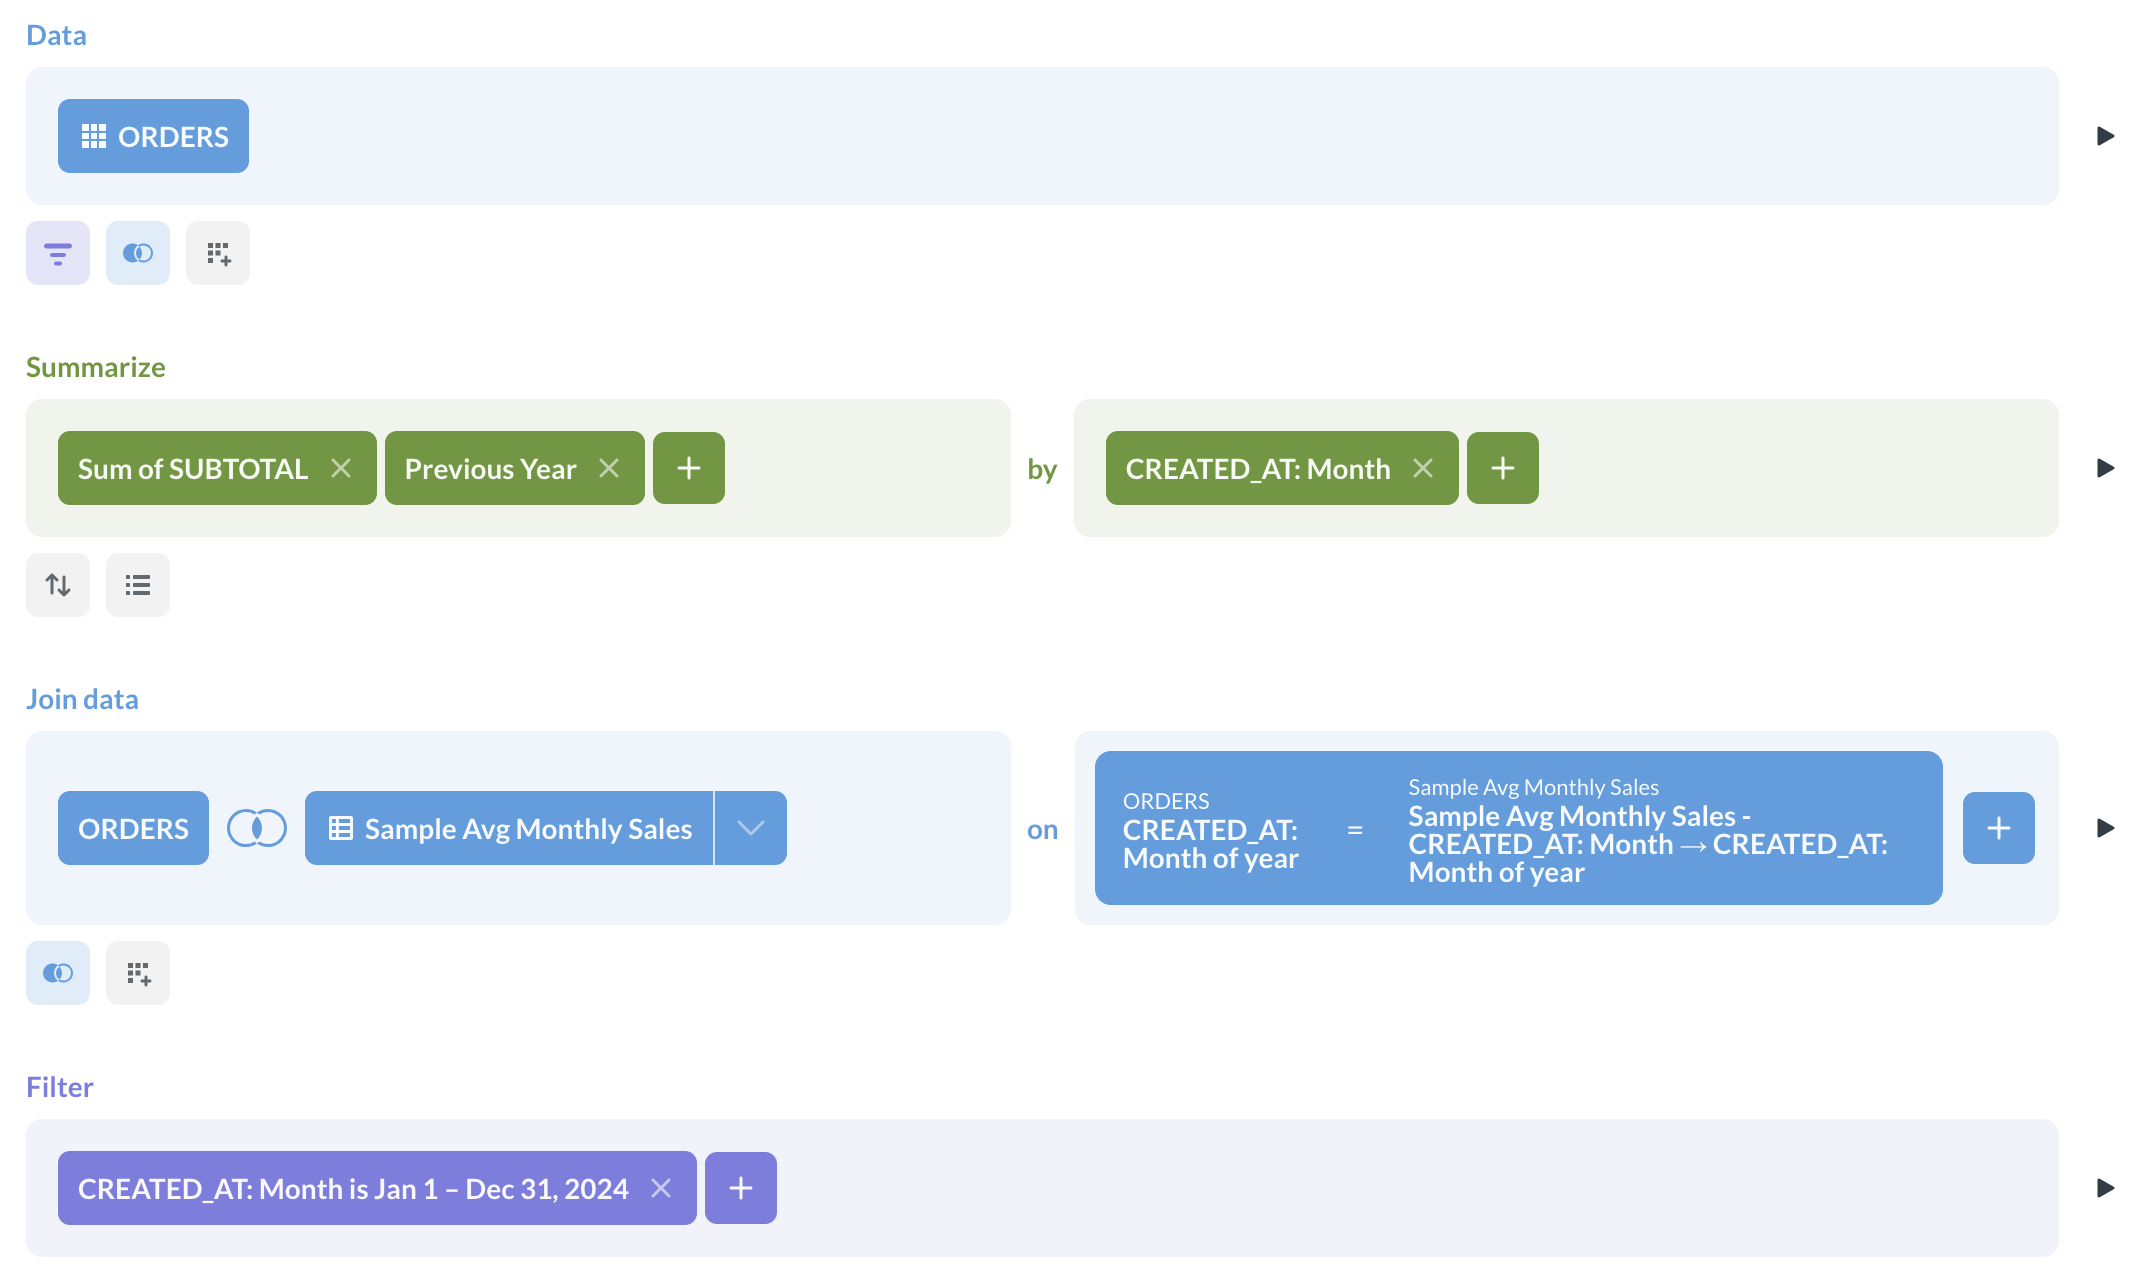
Here’s the notebook for the final question:
and for “Sample Avg Monthly Sales”:
EDIT: For completeness, the SQL query:
SELECT
  *
FROM
  (
    SELECT
      mo,
      sales,
      lag(sales, 12) OVER (ORDER BY mo) AS prev_sales,
      avg(sales) OVER (PARTITION BY extract(MONTH FROM mo)) AS avg_sales
    FROM
      (
        SELECT
          date_trunc('month', created_at) AS mo,
          sum(total) AS sales
        FROM
          orders
        GROUP BY
          mo
      ) r
  ) s
WHERE
  mo BETWEEN '2024-1-1' AND '2024-12-31'
ORDER BY
  mo
Thanks! Yes, something similar, on top of the chart is the KPI card.
You should be able to duplicate the final question and change its viz to Trend. You might have to fiddle with the sort order so the trend can find the data.