Aggregations on Individual "Grouped By" Fields AND Showing the records within each group

I would like to see a feature which allows aggregate functions to be done on “Grouped By” fields while ALSO allowing the ability to see each of the records within each group in the result of the query (Raw Data)

My use case is a view which consists of all courses taken by all students at a school. There is a record for every course that every student has ever taken.

For example, let’s say I want to see all the courses of each individual student, the number of credits the student has earned in that course, and THEN the total number of credits that student has earned in general (it could either display on every single record or once per student).

1 Like

Hi @Blake
If I understand your request correctly, this will be possible in the upcoming 0.33 with the new query browser.
Read more about it: https://metabase.com/blog/a-query-for-your-thoughts/index.html

Hey flamber. Thanks for the reply.

I am now in the .33 beta trying to do this. However, I am still not able to do this. Basically what I want to do is the equivalent of a window function in postgres like the following:

SUM (creditsearned) OVER (PARTITION BY studentid)

Which would give results that look like this
studentid, coursename, creditsearned, totalcreditsearned
123, physics, 1, 3,
123, math, 0, 3,
123, reading, 1, 3,
123, history, 1, 3,
124, physics, 0, 0,
124, reading, 0, 0,

…If that makes sense

@Blake
Windowing functions are being worked on, but I don’t think they will make it in time for 0.33 - more likely 0.34

Okay, thanks!

Any ideas of when .34 would be released?

0.33.0 is maybe a couple of weeks away, and because it’s a major change of the interface, then I would expect a few minor releases after that before 0.34 might be worked on.

Awesome. Thanks for all the help! Are you one of the head developers for Metabase?

@Blake No, I’m just helping out in the forum and trying to triage the issues.

1 Like

hi there, is this functionality available in the current version? I’ve been trying to do something similar but I couldn’t figure it out.

@spacepluk Without knowing exactly what you’re trying to do, there’s a couple of issues open for windowing, which might be available in 0.34 (no guarantees) - upvote by clicking :+1: on the first post of each issue:
https://github.com/metabase/metabase/issues/9393
https://github.com/metabase/metabase/issues/8977

I'm not sure if these issues are about the same use-case @Blake explained. For example, if I have data that looks like this:

I would like to be able to calculate the average amount per entityId per context per hour/day/etc. while keeping the ability to drill down from the visualization to see the original records.

I think this is a pretty common use-case (e.g. avg sales per customer per product type over time) and is very straight-forward to do in Tableau but I haven't managed to figure out a way to do it in Metabase.

@spacepluk
Maybe I'm completely misunderstanding, but wouldn't you just summarize average by customer, product and timestamp?
Here's an example from the Sample Dataset:

It’s probably me who is failing to explain this clearly and/or misunderstanding things. Please correct me if I’m wrong.

Your example would give the average total per order which in my dataset would be equal to the product price (no discounts, no quantity, one record per transaction). But the number I want to get is the average spent per user per context per time slice. So if a user buys the same thing repeatedly in the same slice that should raise the number (looking for cheaters in my game).

The orders dataset in the examples is not really a good one to illustrate this. If you want I can prepare a testcase with some data (csv?) and maybe a couple of videos.

@spacepluk It might be helpful with how/what you’re doing it on Tableau. And if you can quickly dish up some CSV, then that’ll be great too. It’s not always easy to understand other people’s data :wink:

Sorry for the delay, I got sidetracked with other stuff. Here’s the video and the csv:


The part I can’t figure out how to do in metabase is around the middle of the video. Where I type SUM(Amount)/COUNTD(EntityId) and I can still drill down to the actual registers from the chart.

@spacepluk
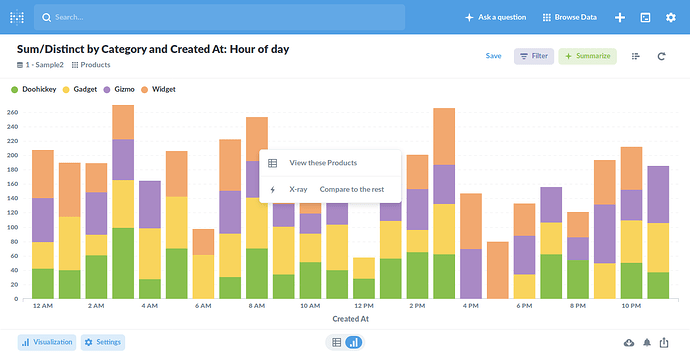
Okay, so let's see if I understood this correctly. I just did this in the Sample Dataset, since your data looks very similar. Seems like you're just looking for Custom Expression:


You could even do it with a joined table:

Wow, I have no idea how I missed that! This is exactly what I needed, thanks! :slight_smile:

I’m not sure if it’s related to this, but when I drill down on one of the chunks in the stacked bar chart it shows data for the previous day.

@spacepluk Which version of Metabase? There are a lot of fixes to timezone in the last couple of versions, and there will be even more in the upcoming 0.34.0
Can you reproduce with Sample Dataset, then please describe how?
I remember another issue about drill doing something it shouldn’t , but I need to be able to reproduce, to better understand and search for issues.