Is is currently planned/possible to customise the ranges within the Map view ?
Numbers ranged
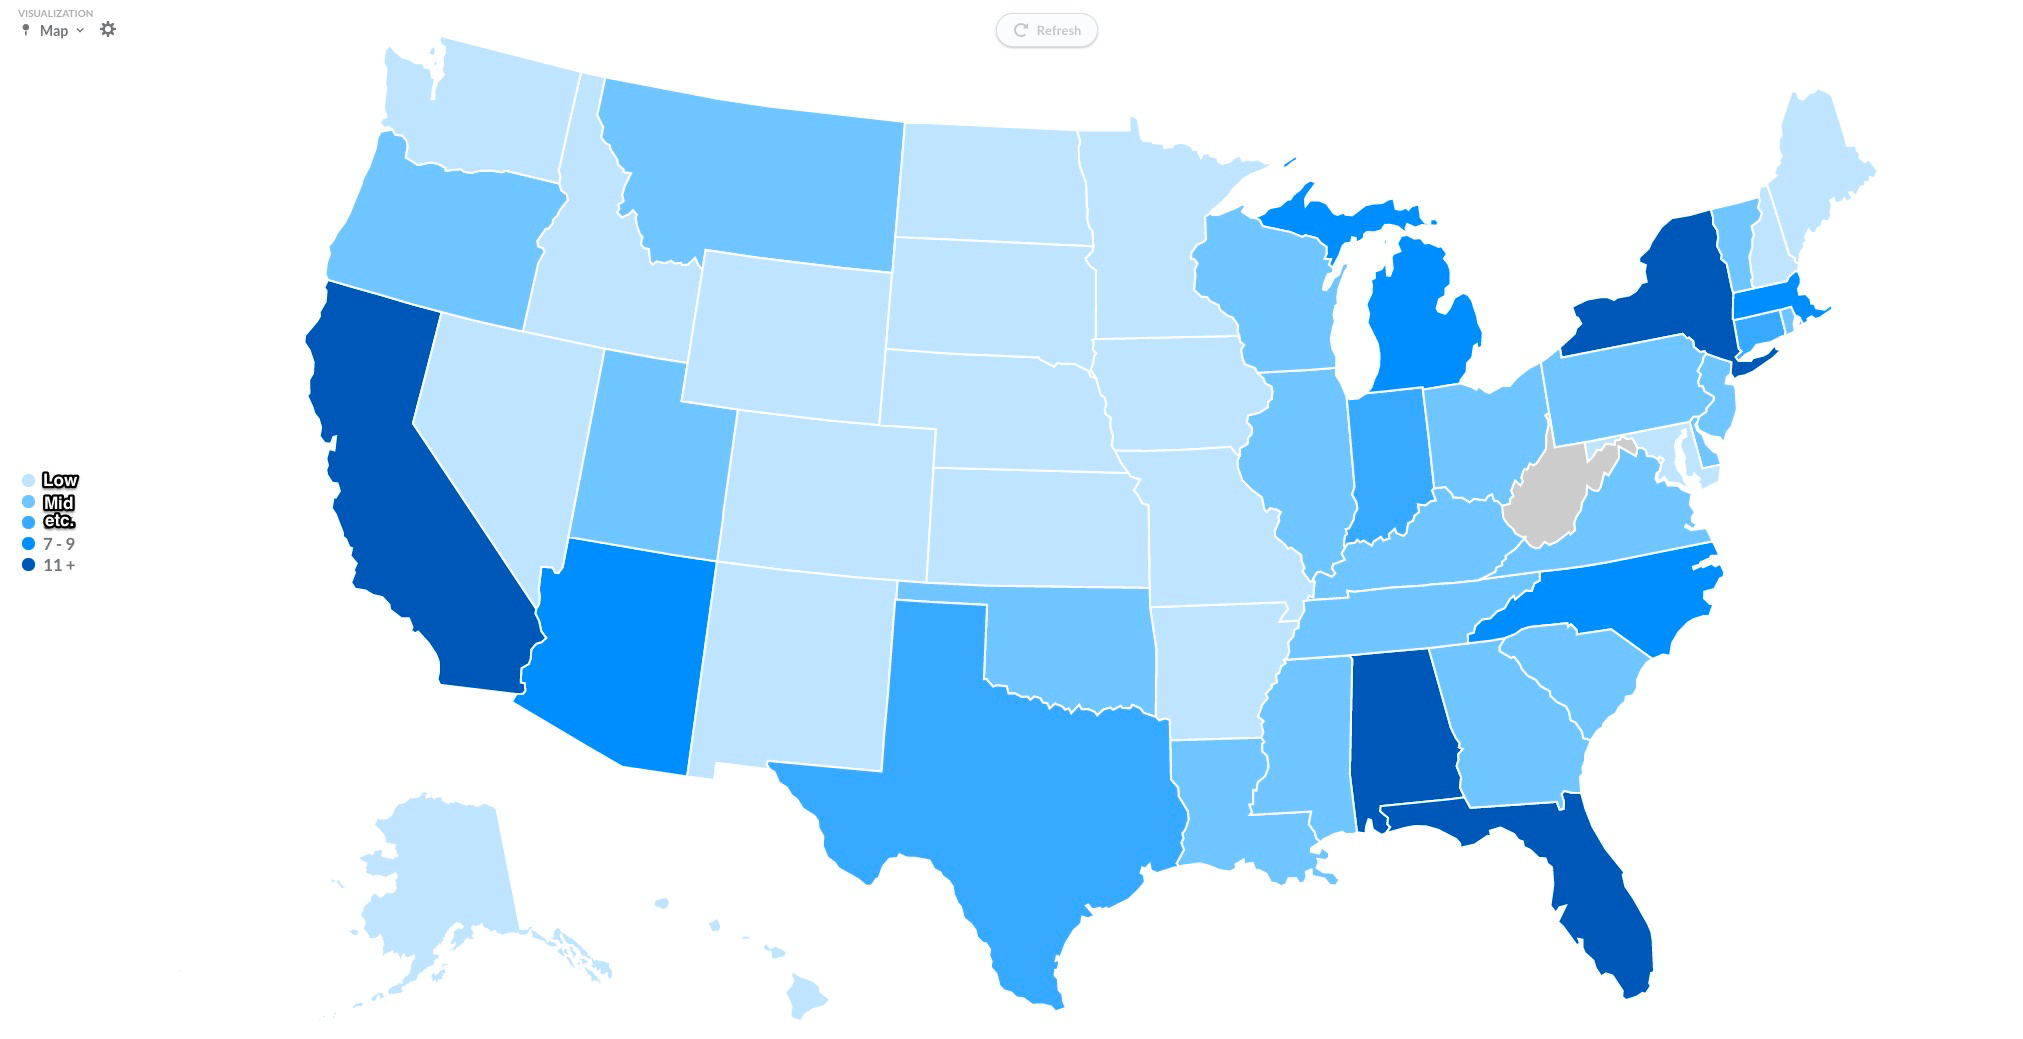
From a general data presentation point of view, the auto generated legend can be a bit painful, I would love to be able to determine where my buckets actually begin and end, as well as determining how many buckets I need (as the below is less than usefull)
Text Ranges
I am also looking to simplify further by mapping scores to words.
1 = Low
2 = Mid
3 = High
Is anything along these lines currently possible ?