Hi,
I am quite new to metabase so apologies if I am not using the right vocabularies.
I have some data coming from a survey tool (kobotoolbox) that I loaded into a postgresql database. We have quite a bit of multiple choice questions which are represented as boolean columns within our main data tables, for example:
|org|com_social_media_facebook|com_social_media_twitter|com_social_media_youtube|com_social_media_whatsapp|
|---|---|---|---|---|---|
|org1|1|1|0|1|
|org2|1|0|0|1|
|org3|1|1|1|1|
I figured that this was not ideal and thus generated some unpivoted views using SQL:
create view survey_com_social_media as select s.uuid, t.social_media
from survey s
  cross join lateral (
     values
(s.com_social_media_facebook, 'facebook'),
(s.com_social_media_twitter, 'twitter'),
(s.com_social_media_youtube, 'youtube'),
(s.com_social_media_whatsapp, 'whatsapp'),
(s.com_social_media_telegram, 'telegram'),
(s.com_social_media_linkedin, 'linkedin'),
(s.com_social_media_instagram, 'instagram'),
(s.com_social_media_snapchat, 'snapchat'),
(s.com_social_media_tiktok, 'tiktok')
  ) as t(value, social_media)
where value notnull and value = 1
which gave me something like this
| org_id | social_media |
|---|---|
| org1 | |
| org1 | |
| org1 | |
| org2 | |
| org2 | |
| org3 | |
| org3 | |
| org3 | youtube |
| org3 |
Is this a good representation of the data?
After I join the tables, I am able to generate a question of the distribution amongst the different answers, and to filter by other properties of my org table.

However, as I am currently still exploring the data, I find that metabase's xray fonctionality for my view is not very helpful. It does not display the field social_media, only some of the field available in the joined main table.
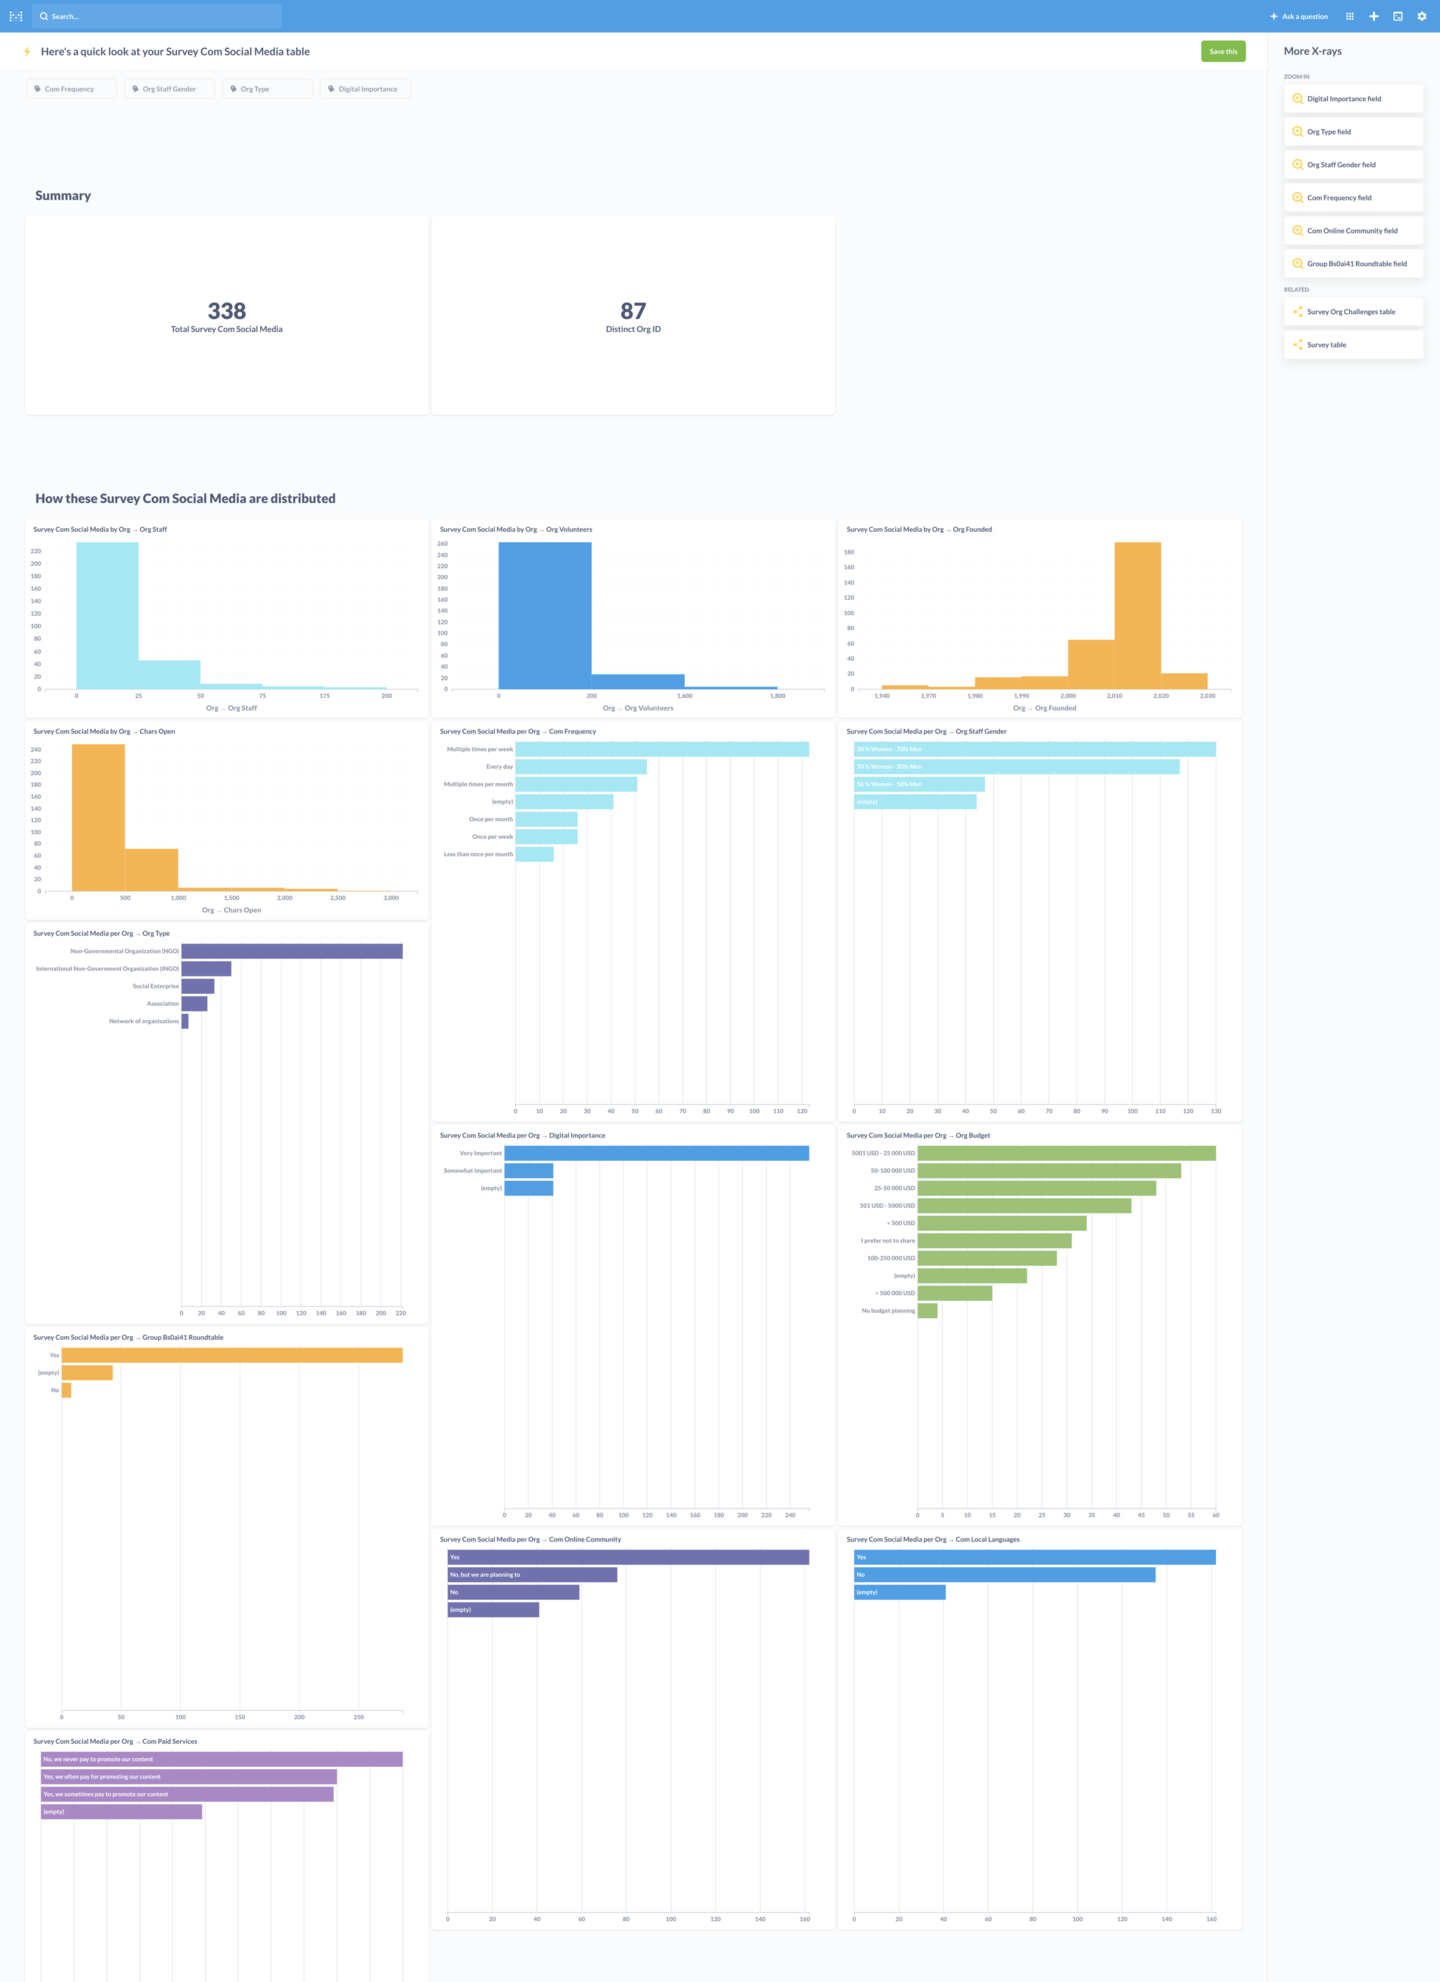
Is there a better way to represent the data which would give me more valuable automated data exploration?