Environment:
EC2 t2.large - 2 vCPUs 8GB ram 100GB disk
Ubuntu - Java8 - Docker
I'm having the current issue:
This Java process is consuming 100% CPU. It looks like a logging process, but I need to know how to disable it.
In my host, already disabled and, inside the container, changed openjdk/logging.properties field:
'LEVEL' to off.
Then I commited the image and restarted metabase with new configs and nothing happened. How the hell do I make Java stop writing logs and eating all my CPU?
Thanks.
Hi @mgalvani
Which version of Metabase?
I doubt it’s logging that consuming your resources, but you can modify logging:
https://metabase.com/docs/latest/operations-guide/log-configuration.html
I think it’s a sync process or someone downloading XLSX export - or maybe X-rays.
This goddamn process is the only one consuming everything.
X-Rays and syncs are off and i’m actually the only user logged in right now.
I’ll try disabling it and let you know.
Thanks!
Do you know what is Dlog4j default directory and which line I should change to turn it off?
And if possible, how to do that on docker. I’m not sure how to run metabase.jar with [options] because it starts running as soon as I start the container
@mgalvani
Can you check the Metabase logs, just to see if there’s extreme amount of activity?
You cannot disable sync - you can either have it hourly or daily.
The Log4j is located inside the JAR-file in /resources (I think)
Managed to disable those logging configs by removing log4j and now ‘java -jar metabase.jar’ is consuming all the CPU lol.
Really don’t know what to do.
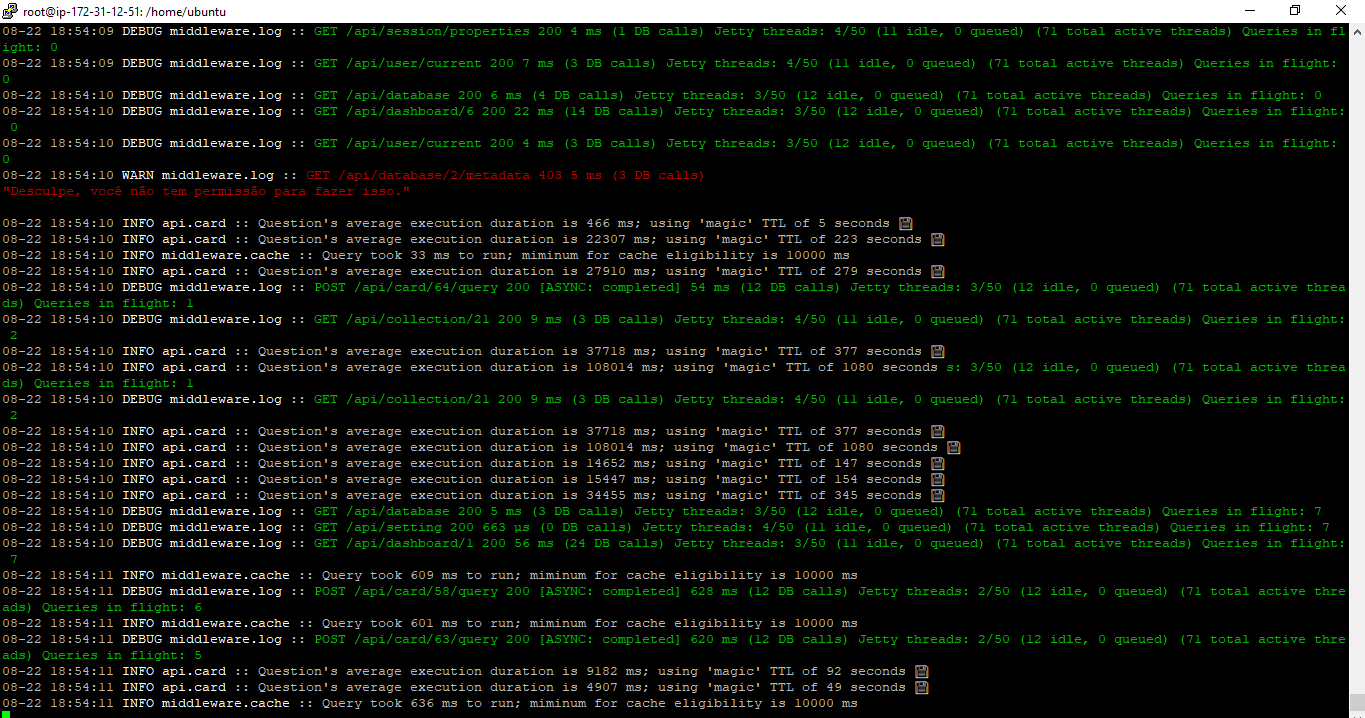
This is what docker logs -f [container] looks like when I refresh a dashboard, for example:
And then, this is what happens on the browser:
Sync is set daily 1am
@mgalvani
Which version of Metabase?
Okay, but when you don’t show any dashboards, do you see a lot of log activity? I highly doubt this is caused by logging.
When you see the browser error, what do you see in the log - and in your browser console?
But has sync ever been done with the databases?
It seems like you’re getting a permission error to database id=2 - are you not accessing Metabase as admin?
@flamber
I’m using 32.10 but gonna test 33.0 now.
When I’m doing nothing, logs keep static.
I’m using admin on both metabase and database. Thought about restricting the user permissions on database (oracle) to visualize only the views I need to generate the dashboards. This way it shouldn’t sync everything, right?
@mgalvani
I’m not sure if anything has changed specifically to sync processes between 0.32.10 and 0.33.0, but there has been so many changes that it’s hard to remember them all.
But if you don’t do anything and the logs are “static”, then that should tell you that it’s not a problem with the logs hogging the resources.
Yes, if you only give Metabase access to a database with a restricted database-user, then Metabase can only sync whatever that database-user can see.
But I was noting the red 403 error in the Metabase log, which is some Metabase-user who doesn’t have permissions to database id=2 (check Admin > Databases to see the id in the URL)
@flamber
I’m connecting to only 1 database and the user is admin.
Anyway, I migrated to a 4 vcpus EC2 and the high CPU problem is gone, but I still have the page crash problem.
The ‘database permission denied’ is gone as well.
Any suggestion what this page crash might be?
@mgalvani
Without any logs, I would not know what’s going on.
Check your docker logs, Metabase logs, browser console.
@flamber there's nothing on metabase/docker logs.
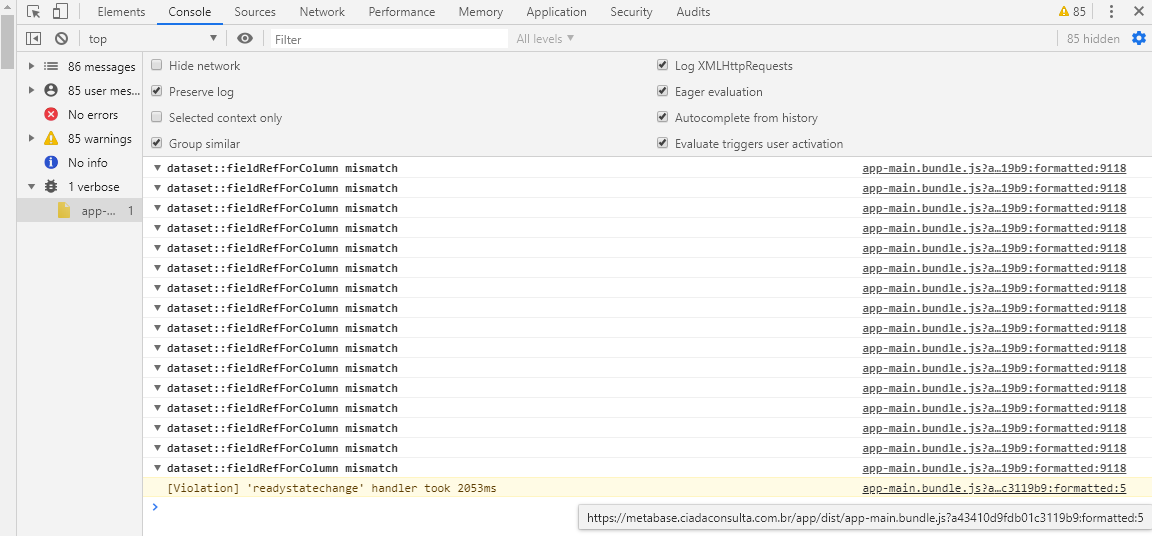
Using the browser debugger, this is what happens on console tab when page crashes:
@mgalvani
Try a different browser, since it sounds like the problem is specific to that browser and since there’s no Metabase/docker logs, then I’m guessing it’s not crashing Metabase.
@flamber
Tried Chrome/Firefox/Brave and all of them crashed.
Browser logs also say: "Stopped before potential memory crash". Don't know exactly what that means. Trying to understand which script/function it is related to.
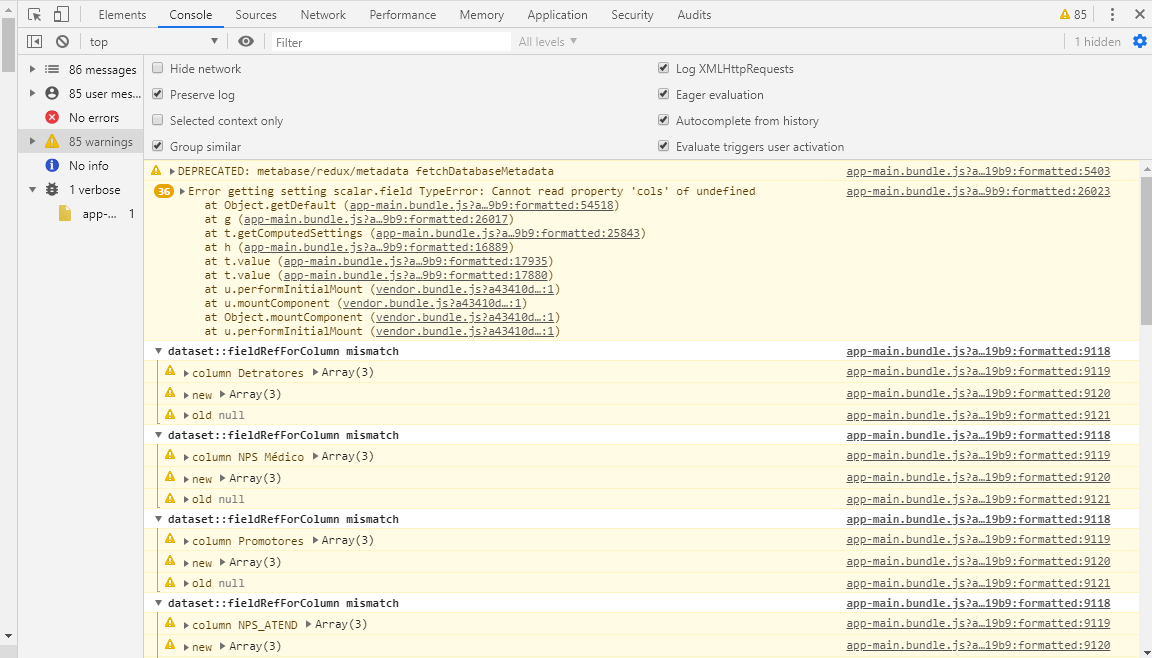
Also throws this:
[Violation] 'readystatechange' handler took 2053ms
Could it be related to Post-aggregation filters mess up histograms where x-axis is a binned number · Issue #10493 · metabase/metabase · GitHub ?
@mgalvani
Are you using 0.32.10 or 0.33.0 now?
When does this crash occur?
Make sure you don’t have some extension (on all browsers), which might be causing the problem (use incognito mode, without extensions).
The error is scalar.field, which sounds like a Number visualization.
I’m using 0.33.0.
Once I open a dashboard that includes 15 number cards, after around 30s it crashes.
There are no extensions running and it also crashes using incognito mode.
@mgalvani
Okay, can you take a backup of your metadata, and then in the table report_dashboardcard manually change the dashboard_id to some ID other than the problematic dashboard.
I’m trying to figure out if we can find the card, which is likely causing a javascript loop, so we can get it fixed.
@flamber the problem is it happens with different dashboards.
All of them have the same cards, but with different filters defined in SQL queries.
Anyway, I’ll try to change the dashboard ID and see what happens. It would be great if we could find which card is causing the problem and why.
Maybe long time query response could be the cause? The queries behind those cards are kinda heavy.
@mgalvani
Another option would be to create a new empty dashboard and slowly fill it with cards one-by-one and saving+refreshing between each card.
I don’t think it’s a slow query - then you should just see a spinner until there’s data. I’m fairly sure there’s a javascript loop somewhere (possibly a Number card, since it created an error).
It’s the first time I’ve heard of something like this, so it’s a little difficult to debug.