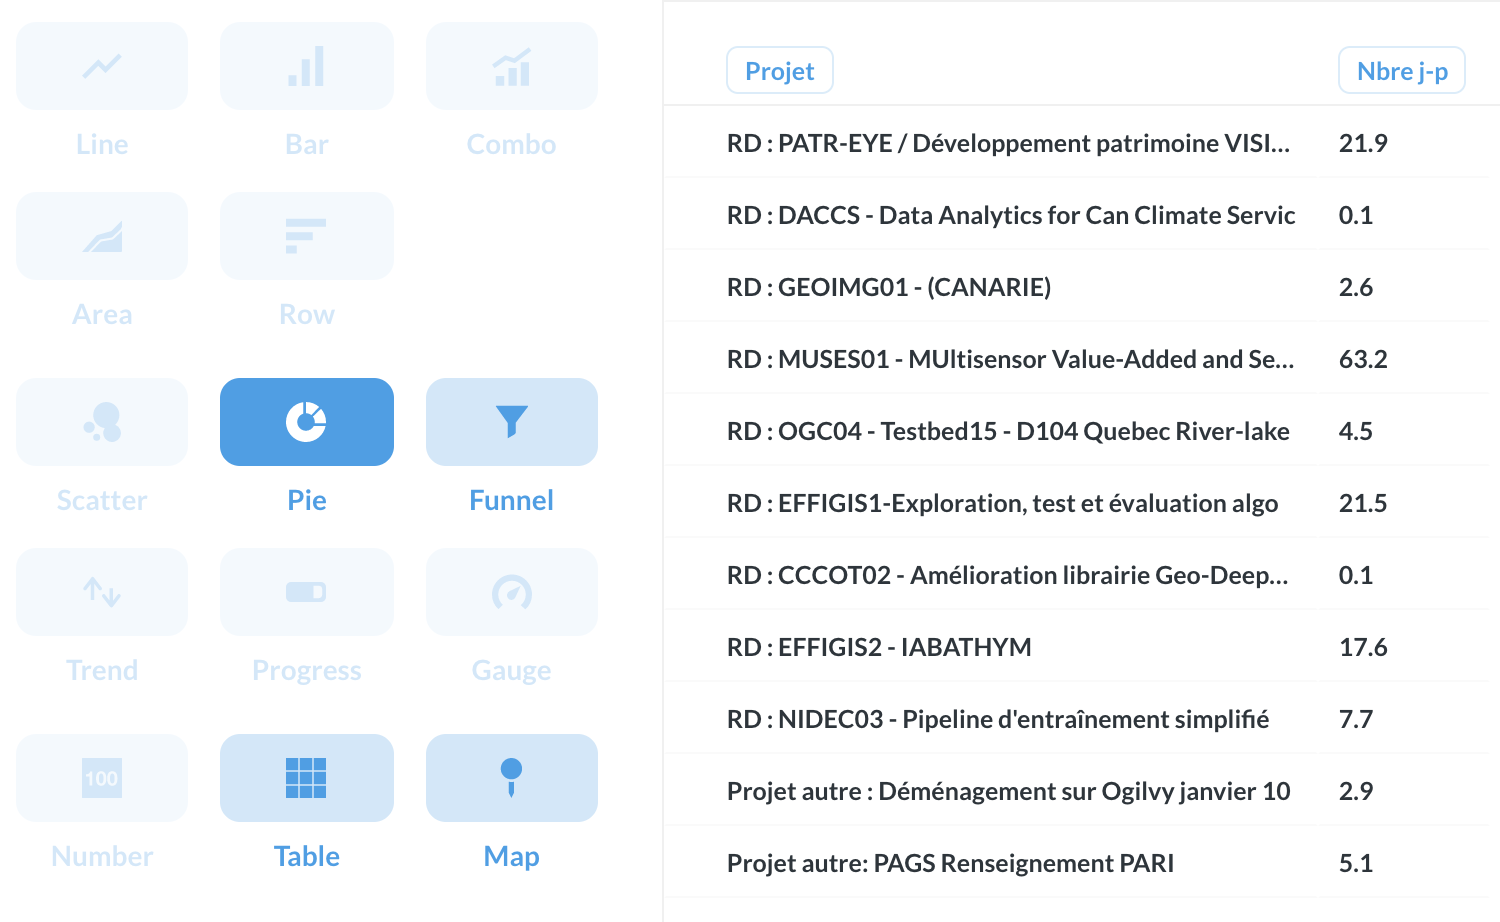
Both the Row and Pie problems you’re running into seem to be caused by the fact that it seems like your Nbre j-p column is a string rather than a number (assuming you’re trying to use that column as your metric/measure in both cases). What you can do is go to the Admin Panel from the gear in the top-right of Metabase, then go to the Data Model section, select the database that column is in from the dropdown in the top-left, pick the table the column is in from the sidebar, then scroll to the column and see what its “Type” is set to. Change it to “Number” if it’s not set to anything else and let me know if that fixes these issue for you.
Success. It was something like this, in my request I had FORMAT(SUM(charge)/420,1) AS 'j-p' that outputted a string. I changed for ROUND(SUM(cdt.charge)/420,1) AS 'j-p' and now it works fine, I can get all the visualizations that I need.