The standard metabase visualisation has the Y-Axis on the left side of the chart. Is there a way to put it on the right side of the chart?
This would be specially interesting when creating dashboards that display “opposing forces”, so that one could create the impression that one of them comes from the right and the other comes from the left.
I can’t seem to find this option. When I have a combo chart, I can see the option to display a secondary Y-Axis, but I can’t find an option to change the side of the Y-axis.
Am I missing something ? Also, is this available in row charts and bar charts or only combo charts ?
@celioxf
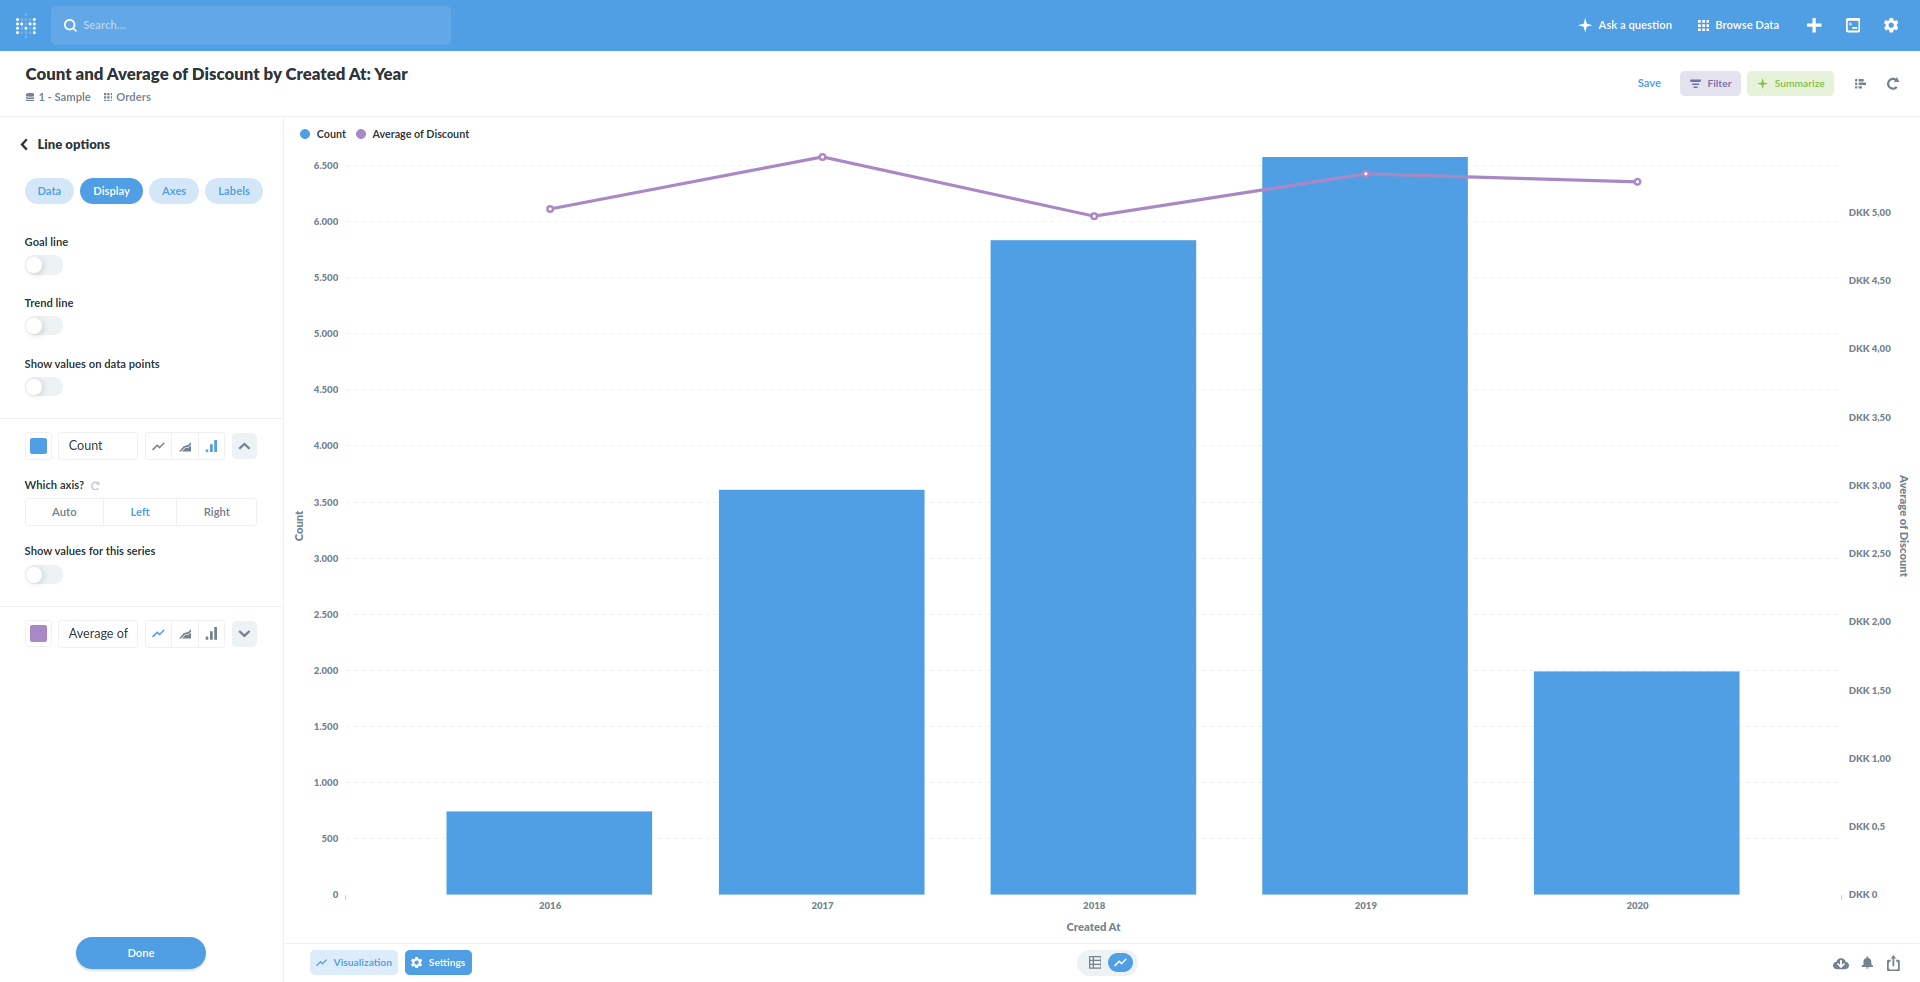
Do you have multiple series? Otherwise, it might be hidden, and you can add another series, which will allow you to define the Y-axis position, and then you can remove the extra series.
Line/Bar/Area/Combo and Scatter are mostly the same underlying code, so they should behave the same.
Row chart is completely different and has several issues open.
 on the first post