| 198 |
2020-06-26 13:48:11.097561+00 |
2020-06-26 13:48:11.097561+00 |
4 |
3 |
13 |
14 |
51 |
14 |
[{“parameter_id”:“bd940c8d”,“card_id”:51,“target”:[“dimension”,[“template-tag”,“Zeitraum”]]},{“parameter_id”:“9c47220f”,“card_id”:51,“target”:[“dimension”,[“template-tag”,“Bike”]]},{“parameter_id”:“c19adf3a”,“card_id”:51,“target”:[“dimension”,[“template-tag”,“Standort”]]}] |
{“column_settings”:{"[“name”,“2x”]":{“number_style”:“percent”,“number_separators”:",."}},“card.title”:“der Kunden haben 2x ausgeliehen”} |
| 197 |
2020-06-26 13:48:11.097561+00 |
2020-06-26 13:48:11.097561+00 |
4 |
3 |
10 |
14 |
50 |
14 |
[{“parameter_id”:“bd940c8d”,“card_id”:50,“target”:[“dimension”,[“template-tag”,“Zeitraum”]]},{“parameter_id”:“9c47220f”,“card_id”:50,“target”:[“dimension”,[“template-tag”,“Bike”]]},{“parameter_id”:“c19adf3a”,“card_id”:50,“target”:[“dimension”,[“template-tag”,“Standort”]]}] |
{“column_settings”:{"[“name”,“1x”]":{“number_style”:“percent”,“number_separators”:",.",“decimals”:0}},“card.title”:“der Kunden haben 1x ausgeliehen”} |
| 196 |
2020-06-26 13:48:11.097561+00 |
2020-06-26 13:48:11.097561+00 |
10 |
1 |
29 |
0 |
|
14 |
[] |
{“virtual_card”:{“name”:null,“display”:“text”,“visualization_settings”:{},“dataset_query”:{},“archived”:false},“dashcard.background”:false,“text”:"## Kennzahlen zu Kunden & Kundenverhalten"} |
| 195 |
2020-06-26 13:48:11.097561+00 |
2020-06-26 13:48:11.097561+00 |
4 |
1 |
0 |
0 |
|
14 |
[] |
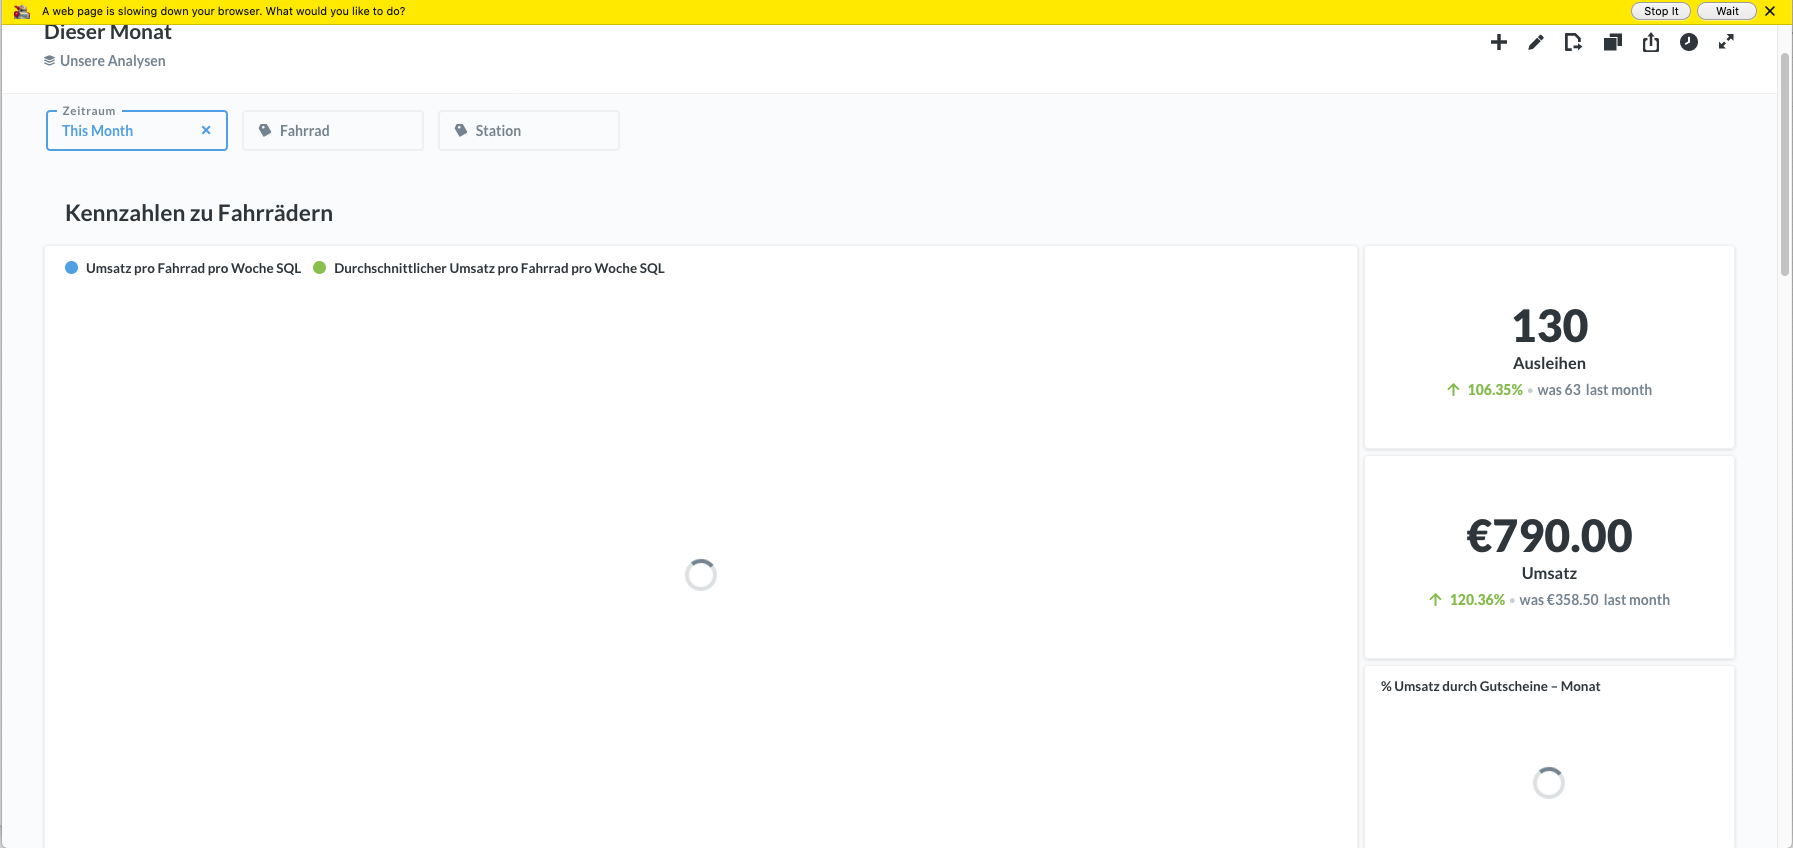
{“virtual_card”:{“name”:null,“display”:“text”,“visualization_settings”:{},“dataset_query”:{},“archived”:false},“dashcard.background”:false,“text”:"## Kennzahlen zu Fahrrädern"} |
| 194 |
2020-06-26 13:48:11.097561+00 |
2020-06-26 13:48:11.097561+00 |
9 |
7 |
33 |
0 |
47 |
14 |
[{“parameter_id”:“9c47220f”,“card_id”:47,“target”:[“dimension”,[“template-tag”,“bike”]]},{“parameter_id”:“c19adf3a”,“card_id”:47,“target”:[“dimension”,[“template-tag”,“standort”]]}] |
{} |
| 193 |
2020-06-26 13:48:11.097561+00 |
2020-06-26 13:48:11.097561+00 |
18 |
9 |
19 |
0 |
44 |
14 |
[{“parameter_id”:“bd940c8d”,“card_id”:44,“target”:[“dimension”,[“template-tag”,“Zeitraum”]]}] |
{“column_settings”:{"[“name”,“case”]":{“decimals”:5},"[“name”,“Reservierungen pro Tag”]":{“decimals”:2,“show_mini_bar”:false,“number_style”:“decimal”,“number_separators”:", “},”[“name”,“Anteil Einkaufsfahrten”]":{“number_style”:“percent”,“show_mini_bar”:true},"[“name”,“Anteil Freizeitfahrten”]":{“show_mini_bar”:true,“number_style”:“percent”},"[“name”,“Umsatz”]":{“suffix”:“€”,“number_separators”:", “},”[“name”,“Umsatzsteigerung”]":{“number_style”:“percent”},"[“name”,“Steigerung der Reservierungen”]":{“number_style”:“percent”},"[“name”,“Durchschnittliche Fahrzeit”]":{“suffix”:" min"}},“table.pivot_column”:“Reservierungen”,“table.cell_column”:“Umsatz”,“card.title”:“Detailansicht der Tabelle”} |
| 192 |
2020-06-26 13:48:11.097561+00 |
2020-06-26 13:48:11.097561+00 |
9 |
7 |
33 |
9 |
12 |
14 |
[{“parameter_id”:“bd940c8d”,“card_id”:12,“target”:[“dimension”,[“field-id”,116]]},{“parameter_id”:“9c47220f”,“card_id”:12,“target”:[“dimension”,[“template-tag”,“bike”]]},{“parameter_id”:“c19adf3a”,“card_id”:12,“target”:[“dimension”,[“template-tag”,“standort”]]}] |
{“graph.y_axis.title_text”:“Fahrten”,“graph.show_values”:false,“table.cell_column”:“Fahrten”,“graph.x_axis.title_text”:“Wochentag”,“graph.y_axis.scale”:“linear”,“graph.metrics”:[“Fahrten”],“table.pivot_column”:“endTime”,“column_settings”:{"[“ref”,[“field-id”,107]]":{},"[“name”,“endTime”]":{“time_style”:“k:mm”,“time_enabled”:null,“date_abbreviate”:true},"[“name”,“Fahrten”]":{“number_style”:“percent”}},“series_settings”:{“count”:{“color”:"#88BF4D"},“February, 2020”:{“display”:“bar”},“March, 2020”:{“display”:“bar”},“April, 2020”:{“display”:“bar”},“May, 2020”:{“display”:“bar”},“June, 2020”:{“display”:“bar”},“April 1, 2020, 12:00 AM”:{“color”:"#509EE3",“title”:“April, 2020”},“May 1, 2020, 12:00 AM”:{“color”:"#EF8C8C",“title”:“May, 2020”}},“graph.dimensions”:[“wochentag”,“endTime”],“stackable.stack_type”:null} |
| 191 |
2020-06-26 13:48:11.097561+00 |
2020-06-26 13:48:11.097561+00 |
4 |
3 |
30 |
8 |
36 |
14 |
[] |
{“card.title”:“Erste Fahrten”} |
| 190 |
2020-06-26 13:48:11.097561+00 |
2020-06-26 13:48:11.097561+00 |
4 |
3 |
1 |
14 |
34 |
14 |
[{“parameter_id”:“9c47220f”,“card_id”:34,“target”:[“dimension”,[“field-id”,215]]},{“parameter_id”:“c19adf3a”,“card_id”:34,“target”:[“dimension”,[“field-id”,214]]}] |
{“card.title”:“Ausleihen”} |
| 189 |
2020-06-26 13:48:11.097561+00 |
2020-06-26 13:48:11.097561+00 |
4 |
3 |
4 |
14 |
33 |
14 |
[{“parameter_id”:“9c47220f”,“card_id”:33,“target”:[“dimension”,[“field-id”,215]]},{“parameter_id”:“c19adf3a”,“card_id”:33,“target”:[“dimension”,[“field-id”,214]]}] |
{“card.title”:“Umsatz”} |
| 188 |
2020-06-26 13:48:11.097561+00 |
2020-06-26 13:48:11.097561+00 |
4 |
3 |
7 |
14 |
32 |
14 |
[{“parameter_id”:“9c47220f”,“card_id”:32,“target”:[“dimension”,[“field-id”,215]]},{“parameter_id”:“c19adf3a”,“card_id”:32,“target”:[“dimension”,[“field-id”,214]]}] |
{“scalar.switch_positive_negative”:true,“column_settings”:{"[“name”,“avg”]":{“number_style”:“percent”}},“card.title”:“des Umsatzes durch Gutscheine”} |
| 187 |
2020-06-26 13:48:11.097561+00 |
2020-06-26 13:48:11.097561+00 |
14 |
9 |
10 |
0 |
31 |
14 |
[{“parameter_id”:“bd940c8d”,“card_id”:9,“target”:[“dimension”,[“template-tag”,“zeitraum”]]},{“parameter_id”:“bd940c8d”,“card_id”:31,“target”:[“dimension”,[“template-tag”,“zeitraum”]]},{“parameter_id”:“9c47220f”,“card_id”:31,“target”:[“dimension”,[“template-tag”,“Bike”]]},{“parameter_id”:“9c47220f”,“card_id”:9,“target”:[“dimension”,[“template-tag”,“Bike”]]},{“parameter_id”:“c19adf3a”,“card_id”:31,“target”:[“dimension”,[“template-tag”,“Standort”]]},{“parameter_id”:“c19adf3a”,“card_id”:9,“target”:[“dimension”,[“template-tag”,“Standort”]]}] |
{“graph.dimensions”:[“Anfang der Woche”],“graph.metrics”:[“avg”],“graph.show_values”:false,“graph.y_axis.title_text”:“Umsatz”,“column_settings”:{"[“name”,“avg”]":{“suffix”:“€”,“number_separators”:", “}},“series_settings”:{“Umsatz pro Standort pro Woche: Werrastraße”:{“title”:“Werrastraße”},“Umsatz pro Standort pro Woche: Franklinstraße”:{“title”:“Franklinstraße”,“line.marker_enabled”:true},“Umsatz pro Standort pro Woche: Eichbergstraße”:{“title”:“Eichbergstraße”,“line.marker_enabled”:true},“Umsatz pro Standort pro Woche: Eulenbaumstraße”:{“title”:“Eulenbaumstraße”,“line.marker_enabled”:true},“Umsatz pro Standort pro Woche: Adolf-Miersch-Straße”:{“title”:“Adolf-Miersch-Straße”,“line.marker_enabled”:true},“Umsatz pro Standort pro Woche: Bothfelder Kirchweg”:{“title”:“Bothfelder Kirchweg”,“line.marker_enabled”:true},“Umsatz pro Standort pro Woche: Häherweg”:{“title”:“Häherweg”},“Umsatz pro Standort pro Woche: Ederstraße”:{“title”:“Ederstraße”,“line.marker_enabled”:true},“Umsatz pro Standort pro Woche: Wingenderstraße”:{“title”:“Wingenderstraße”,“line.marker_enabled”:true},“Umsatz pro Standort pro Woche: Berliner Allee”:{“title”:“Berliner Allee”,“line.marker_enabled”:true},“avg”:{“title”:“Durchschnittlicher Umsatz”,“color”:”#74838f",“display”:“area”},“Umsatz pro Standort pro Woche: Melibocusstraße”:{“title”:“Melibocusstraße”,“line.marker_enabled”:true},“Umsatz pro Standort pro Woche: Hustadtring”:{“title”:“Hustadtring”,“line.marker_enabled”:true}},“graph.show_trendline”:true,“card.title”:“Umsatz pro Standort + Durchschnitt”} |
| 186 |
2020-06-26 13:48:11.097561+00 |
2020-06-26 13:48:11.097561+00 |
4 |
3 |
30 |
0 |
24 |
14 |
[] |
{“card.title”:“neue Registrierungen”} |
| 185 |
2020-06-26 13:48:11.097561+00 |
2020-06-26 13:48:11.097561+00 |
4 |
3 |
30 |
4 |
25 |
14 |
[] |
{“scalar.switch_positive_negative”:false,“card.title”:“Verifizierungen”} |
| 184 |
2020-06-26 13:48:11.097561+00 |
2020-06-26 13:48:11.097561+00 |
14 |
9 |
1 |
0 |
16 |
14 |
[{“parameter_id”:“bd940c8d”,“card_id”:16,“target”:[“dimension”,[“template-tag”,“zeitraum”]]},{“parameter_id”:“bd940c8d”,“card_id”:28,“target”:[“dimension”,[“template-tag”,“Zeitraum”]]},{“parameter_id”:“9c47220f”,“card_id”:28,“target”:[“dimension”,[“template-tag”,“Bike”]]},{“parameter_id”:“c19adf3a”,“card_id”:28,“target”:[“dimension”,[“template-tag”,“Standort”]]},{“parameter_id”:“9c47220f”,“card_id”:16,“target”:[“dimension”,[“template-tag”,“Bike”]]},{“parameter_id”:“c19adf3a”,“card_id”:16,“target”:[“dimension”,[“template-tag”,“Standort”]]}] |
{“graph.show_goal”:false,“graph.y_axis.title_text”:“Umsatz”,“graph.show_values”:false,“table.cell_column”:“cost”,“graph.goal_value”:0,“card.title”:“Umsatz pro Fahrrad + Durchschnitt”,“graph.metrics”:[“cost”],“table.pivot_column”:“reservations”,“column_settings”:{"[“name”,“endTime”]":{“time_style”:“k:mm”,“time_enabled”:null,“date_abbreviate”:true},"[“name”,“sum”]":{“number_style”:“currency”},"[“name”,“cost”]":{“number_style”:“decimal”,“currency_style”:“symbol”,“number_separators”:", “,“suffix”:“€”}},“series_settings”:{“S1X0014”:{“display”:“line”},“Umsatz pro Fahrrad pro Woche SQL: S1E1003”:{“title”:“S1E1003”},“Umsatz pro Fahrrad pro Woche SQL: S1X0003”:{“title”:“S1X0003”},“Umsatz pro Fahrrad pro Woche SQL: S1X0004”:{“title”:“S1X0004”},“Umsatz pro Fahrrad pro Woche SQL: S1X0009”:{“title”:“S1X0009”},“S1X0005”:{“display”:“line”},“Umsatz pro Fahrrad pro Woche SQL: S1E1004”:{“title”:“S1E1004”},“S1X0012”:{“display”:“line”},“S1X0009”:{“display”:“line”},“S1X0018”:{“display”:“line”},“Umsatz pro Fahrrad pro Woche SQL: S1X0012”:{“title”:“S1X0012”},“Umsatz pro Fahrrad pro Woche SQL: S1X0018”:{“title”:“S1X0018”},“Durchschnittlicher Umsatz pro Fahrrad pro Woche SQL”:{“title”:“Durchschnitt”,“color”:”#74838f",“display”:“area”},“Umsatz pro Fahrrad pro Woche SQL: S1X0014”:{“title”:“S1X0014”},“Umsatz pro Fahrrad pro Woche SQL: unknown”:{“title”:“unknown”},“Umsatz pro Fahrrad pro Woche SQL: S1X0002”:{“title”:“S1X0002”,“display”:“line”},“Umsatz pro Fahrrad pro Woche SQL: S1X0005”:{“title”:“S1X0005”},“Umsatz pro Fahrrad pro Woche SQL: S1X0021”:{“title”:“S1X0021”}},“graph.dimensions”:[“Zeitraum”,“licenseplate”]} |