Hello!
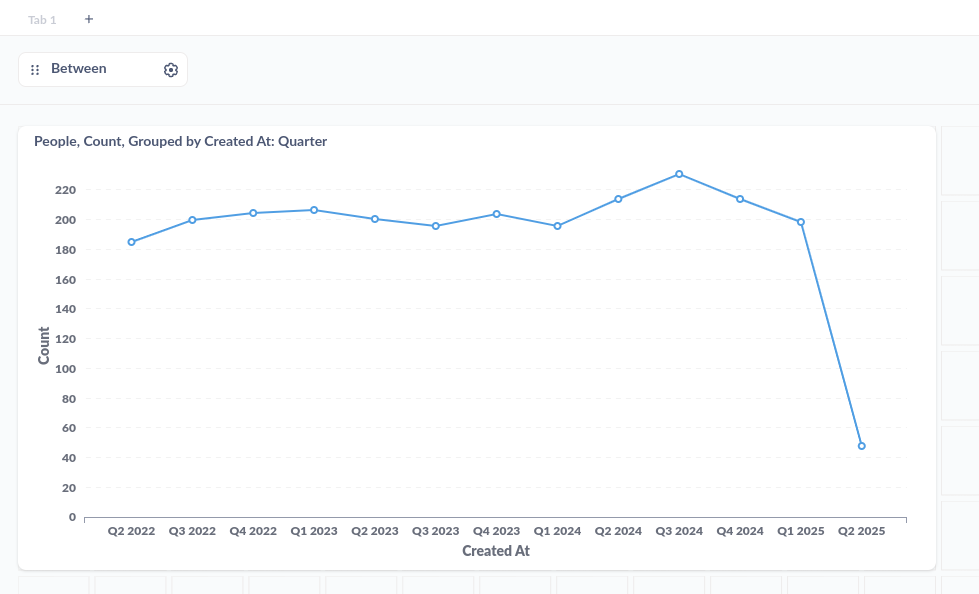
There was a very similar question in the past about the x-axis, but I'm wondering if there is a way to keep the y-axis consistent across multiple questions on a dashboard.
I know that I could use fixed ranges - but what if I need it more dynamically (not knowing if the range is the correct one tomorrow). It would be ideal if the charts had the range of min(value across all charts) to max(value across all charts).
It makes comparing different charts more challenging if you always need to check the scale of each chart and correlate them with each other.
Any magic trick I am not aware of?
Thank you!
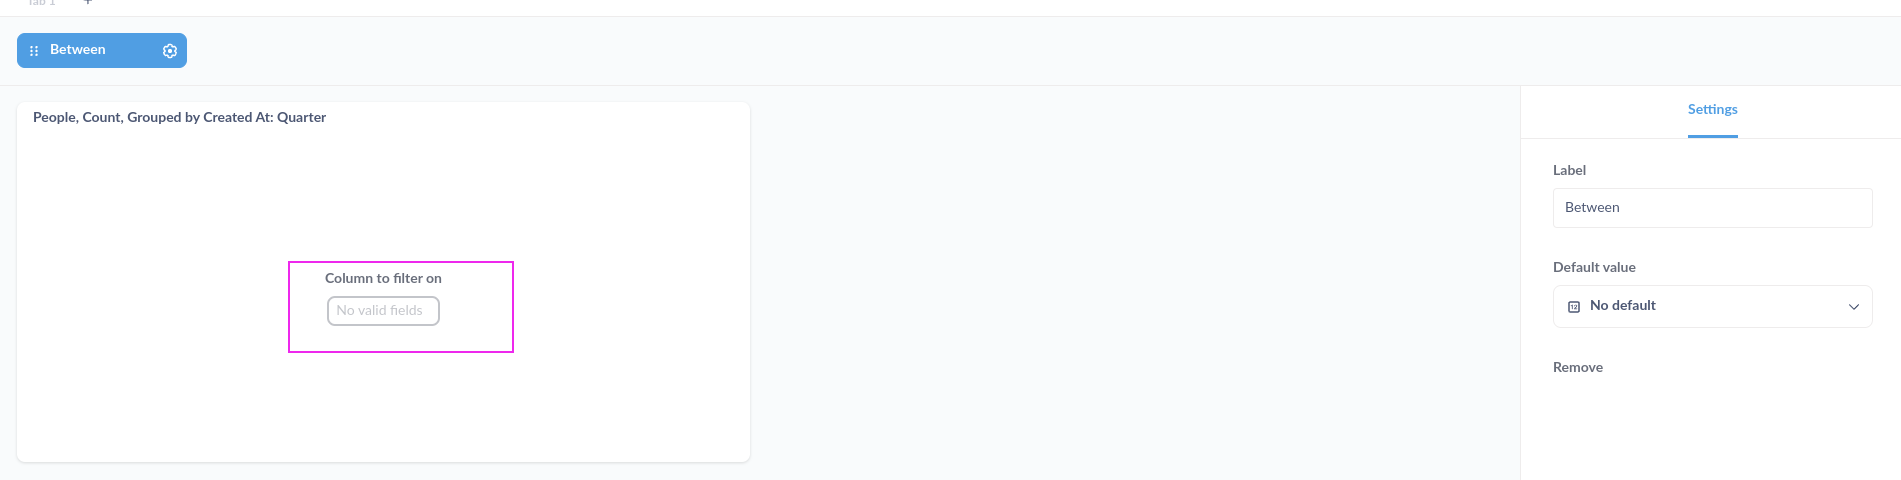
why don't you use filters with default values?