I am trying to create a Pareto where I order values to build the curve up to 80%.
To create this curve, I need the cumulative sum to be ordered correctly.
My current problem is: When I use more than 2 columns in the aggregation, the CumulativeSum() does not respect the ordering performed in the previous step (in fact, no ordering is respected in the next action of the query, and that’s another problem).
To test it: In the aggregation, do a sum and a cumulative sum of any column and add 2 or more groupings. Sort by the Sum and see that the cumulative sum doesn’t work. If you use only 1 grouping, it works perfectly.
I hope this helps in some way.
Counting on everyone’s help!
The last time someone asked about a pareto chart, I wasn’t able to solve the ordering problem using the query editor. (Metabase has no concept of ordering a window function by its input, it wants the metric and dimension to be separate things.) I’ve linked the thread below.
I ended up using a SQL query so I could control the window function ordering directly. It also avoids the need to create 2 separate questions (one for the bars and one for the cumulative line) and either join the results in a 3rd question or use a dashboard combo chart with the 2 questions as data sources.
I spent some time this morning trying to get Pareto charts working in the notebook again. This problem keeps bothering me (and it REALLY bothers me how Tableau can do it).
Today I created 3 separate questions to accommodate different parts of the query:
A base that calculates the per-category sums and the cumulative sum
A question that calculates the total sum of all of the categories
A final question that joins the previous 2 questions together and plots the result
As I posted earlier in the thread, I was having trouble getting Metabase to sort the cumulative sum by the values being summed.
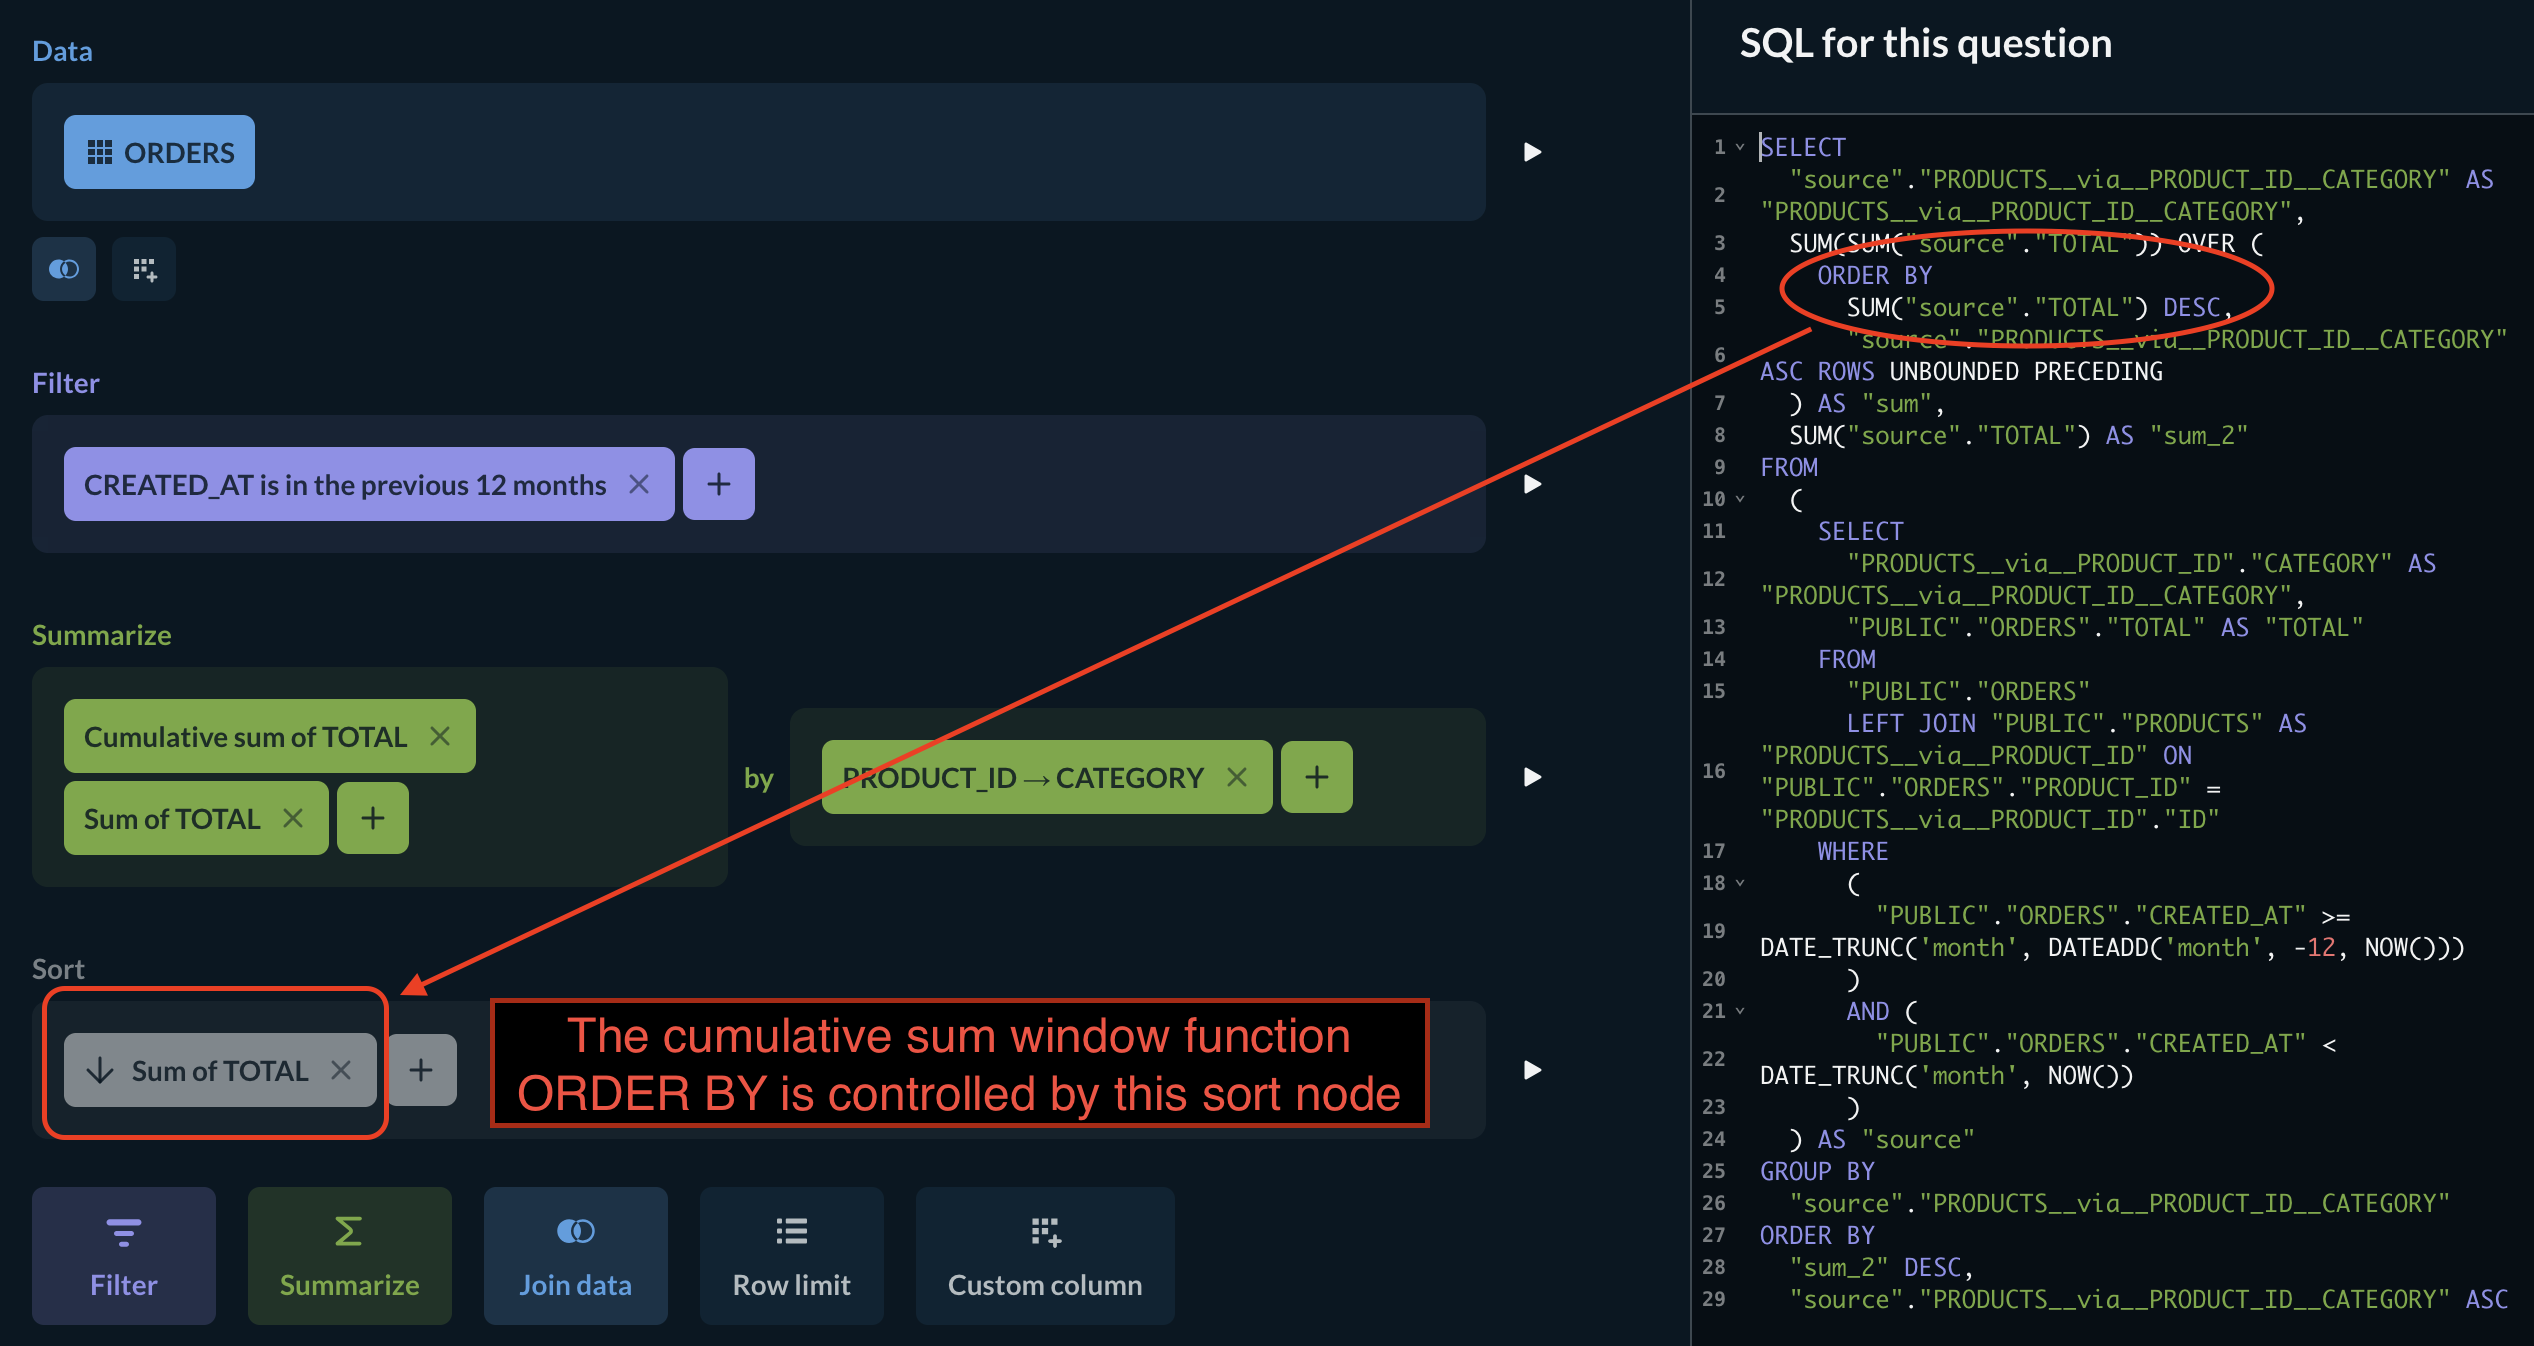
In developing the base cumulative sum question, I discovered that a sort node will influence the sort order of the cumulative sum summary node. Setting the sort to order descending, I can calculate the cumulative sum in the right direction for the pareto chart.
Here’s the cumulative sum notebook from Sample Database showing the effect – flip the sort direction to see it also change in the window function: