@dragonsahead At the time of cpu spike, we are seeing middleware.cache in our logs (attached screenshot). Usually, query while caching takes milli-seconds to run, but at that time it is taking 3-5 minutes. We have to restart metabase service for it to work again. There is only metabase process running on this server.
Has anyone tested this cpu utilization issue with metabase 0.48.5 ? We are still facing this issue, is it possible to downgrade metabase to older version (we were using 0.45.4.3) ?
I have found a solution to our problem. Some time ago there was a problem that an error occurred with custom columns that could only be fixed by inserting a "+0" into the calculations. If you remove the "+0" from the calculation, the calculation runs quickly again and the CPU is no longer overloaded.
I also face metabase instability.
With 0.48.3 it was high CPU issue, and symptom same as adinamarca describe (UI irresponsive and slow. Then goes down).
Then I updated to version 0.48.5 and the problem still occurs, the same symptom, but the CPU is not loaded to 100%, only the high memory usage (some memory leak happen ??).
With both versions, Metabase stays alive for about 10 days, then crashes (usually when memory usage reach 5,1GB).
Today I will try updating to v0.48.6 but I don't see the related fixes in the changelog.
I use Metabase since version 0.36.0.
It is using a single MariaDB, and I have not set up XMS and XMX variables. It's the same environment as 0.47.x, where no issues were detected. And there has been no increase in users using my metabase. All problems started with v 0.48.x
My server rebooted due to a Windows updates on Tuesday (Feb 20), now I have to wait another 8 days to see what happens. I've also started collecting CPU/RAM metrics from my server, so I'll have some record, similar as @rpataro
Was there a resolution to this in the end? We have just upgraded from 0.41.4 to 0.48.6. Servers have been fine for years running metabase and now all of a sudden we have exactly the same issue as reported above
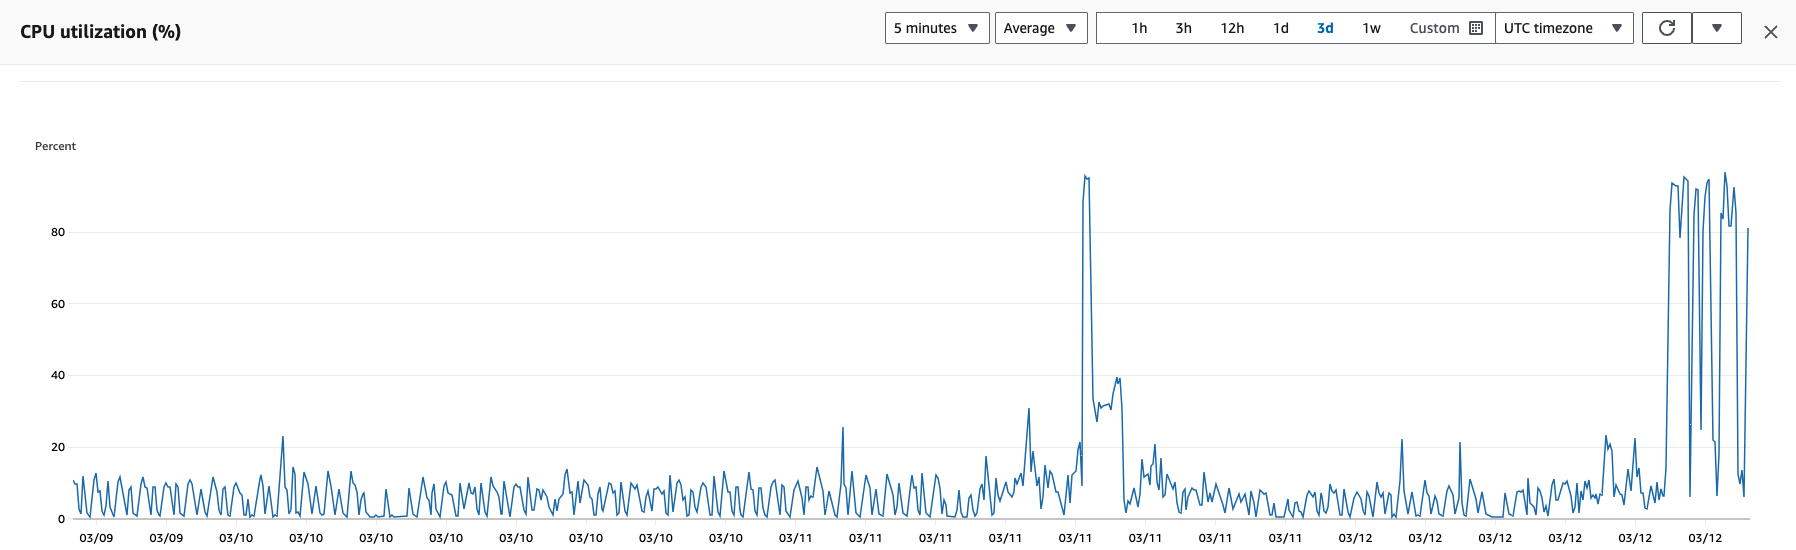
So we upgraded last week, it ran fine for 1 week until randomly CPU spiked and metabase itself became unresponsive, not the server. I checked the logs and there were lots of "java.lang.OutOfMemoryError"'s but we are running in on a server that is to spec with the recommended docs (2GiB of memory). Here are the spikes on CPU utilisation:
So the server has cpu spikes as shown in the image, Network out traffic also matches the cpu utilisation spikes. Metabase itself becomes slow/laggy before becoming completely unresponsive and returning non 200 responses on the /api/health endpoint showing as unhealthy. The logs from metabase simply show lots of java heap memory errors, followed by the unhealthy api responses. Whilst "unhealthy" it continues to try and sync with the database
As rpataro previously mentioned, restarting the server does seem to fix it for between 12-24 hours, before the cpu spikes restart