Metabase's SHOW queries Snowflake more frequent than Sync Settings

We are seeing a higher number of cloud service credits associated with Metabase than we would expect given our current sync and scan settings. We're wondering whether there's an issue causing Metabase to run SHOW queries once per minute, instead of based on the admin sync settings. Example query:
show /* JDBC:DatabaseMetaData.getForeignKeys() */ imported keys in database "<our_database>"

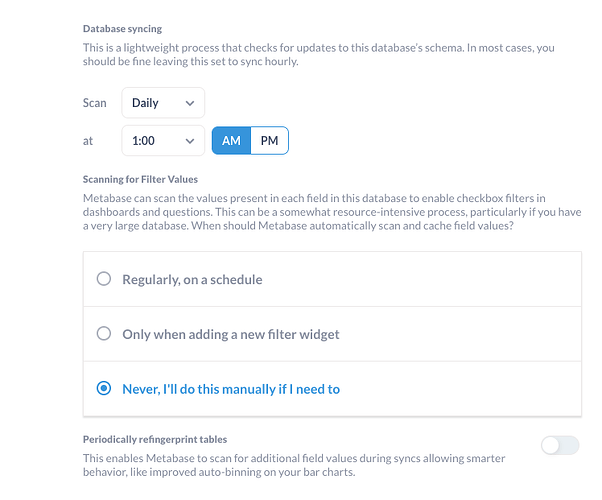
We are seeing this single query run 38827 times and use 35 cloud compute credits in February. Our settings are:

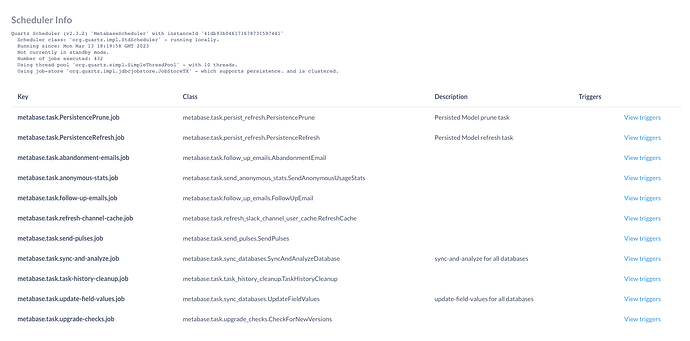
We've already tried excluding the largest schemas in our database and upgrading to the latest Metabase version, but didn't see any changes in our daily queries. We also turned off our Metabase to verify that we didn't have another account linked to the same warehouse (we don't :sweat_smile: ). Taking a look at the logs, there doesn't appear to be specific jobs/tasks running more than every hour. We do see pulses every hour, which is more frequent our daily database sync suggests, but is that normal?

Here are the diagnostics:

{
  "browser-info": {
    "language": "en-US",
    "platform": "MacIntel",
    "userAgent": "Mozilla/5.0 (Macintosh; Intel Mac OS X 10_15_7) AppleWebKit/537.36 (KHTML, like Gecko) Chrome/111.0.0.0 Safari/537.36",
    "vendor": "Google Inc."
  },
  "system-info": {
    "file.encoding": "UTF-8",
    "java.runtime.name": "OpenJDK Runtime Environment",
    "java.runtime.version": "11.0.18+10",
    "java.vendor": "Eclipse Adoptium",
    "java.vendor.url": "https://adoptium.net/",
    "java.version": "11.0.18",
    "java.vm.name": "OpenJDK 64-Bit Server VM",
    "java.vm.version": "11.0.18+10",
    "os.name": "Linux",
    "os.version": "5.10.90+",
    "user.language": "en",
    "user.timezone": "GMT"
  },
  "metabase-info": {
    "databases": [
      "snowflake"
    ],
    "hosting-env": "unknown",
    "application-database": "postgres",
    "application-database-details": {
      "database": {
        "name": "PostgreSQL",
        "version": "13.7"
      },
      "jdbc-driver": {
        "name": "PostgreSQL JDBC Driver",
        "version": "42.5.0"
      }
    },
    "run-mode": "prod",
    "version": {
      "date": "2023-02-19",
      "tag": "v0.45.3",
      "branch": "release-x.45.x",
      "hash": "070f57b"
    },
    "settings": {
      "report-timezone": null
    }
  }
}

Here are other topics that we have looked into:

I would suggest you manually disable the syncing or hide the tables that you don't want Metabase to scan

1 Like

Thanks for the response @Luiggi - Do you suggest manually disabling syncs as a hack because there's something wrong with our Metabase setup or because Metabase isn't syncing as expected? We actually host several Metabase accounts so disabling the sync for every single one isn't a great option and it'd be ideal to understand why this is happening. Is there any other place/issue we could look into?

There’s clearly something that shouldn’t happen there. Can you move to 46.1 and see if this keeps happening?

Hello, we have the same issue, i updated in "You're on version v0.46.2" anyone have solve this, it cost 1K€ per month actually ...

does this keep happening in 46.2? we just upgraded the driver on that version

yes it's very annoying

@Rushkof Are you restricting which schemas are available for your connection in the Metabase UI? There is a field "Schemas" there.

I couldn't consistently reproduce this. The right behavior is to look for primary keys, foreign keys, and imported keys per table (and not per DB as it is running in your case). This would make these queries much faster.

it's not a problem of slowness, even filling the schema area with the corresponding schema, it doesn't stop the interogation every second of the show command ...

@arakaki - Are you suggesting implementing PK's in Snowflake as a solution? As I understand it, PK's are supported but not enforced by Snowflake the way they are in other DB's.

It's about this request:
show /* JDBC:DatabaseMetaData.getForeignKeys() */ imported keys in database "PROD_DB"

No, I'm not suggesting using PKs.

The number of queries is OK. We send one query per table that is synced. If you have hundreds or thousands of tables, it looks like indefine requests.

But these requests should be really light. Getting this metadata per table should like a few ms. But in this case it is scanning the entire db, so if this query takes 3 or 4s to run, it can lock the db and consume a lot of credits.

We just fixed another issue that might have caused this regression

We just submitted a PR, it will be out on 46.3

2 Likes

We upgraded to 46.3 last week and have seen a ~98% drop in cloud service credits. Thanks y'all!

not resolved for me in 46.4, @marcellom can you share your database configuration for snwoflake in metabase please ?

{
  "browser-info": {
    "language": "en-US",
    "platform": "MacIntel",
    "userAgent": "Mozilla/5.0 (Macintosh; Intel Mac OS X 10_15_7) AppleWebKit/537.36 (KHTML, like Gecko) Chrome/113.0.0.0 Safari/537.36",
    "vendor": "Google Inc."
  },
  "system-info": {
    "file.encoding": "UTF-8",
    "java.runtime.name": "OpenJDK Runtime Environment",
    "java.runtime.version": "11.0.19+7",
    "java.vendor": "Eclipse Adoptium",
    "java.vendor.url": "https://adoptium.net/",
    "java.version": "11.0.19",
    "java.vm.name": "OpenJDK 64-Bit Server VM",
    "java.vm.version": "11.0.19+7",
    "os.name": "Linux",
    "os.version": "5.10.90+",
    "user.language": "en",
    "user.timezone": "GMT"
  },
  "metabase-info": {
    "databases": [
      "snowflake"
    ],
    "hosting-env": "unknown",
    "application-database": "postgres",
    "application-database-details": {
      "database": {
        "name": "PostgreSQL",
        "version": "13.8"
      },
      "jdbc-driver": {
        "name": "PostgreSQL JDBC Driver",
        "version": "42.5.1"
      }
    },
    "run-mode": "prod",
    "version": {
      "date": "2023-05-24",
      "tag": "v0.46.4",
      "branch": "release-x.46.x",
      "hash": "f858476"
    },
    "settings": {
      "report-timezone": null
    }
  }
}

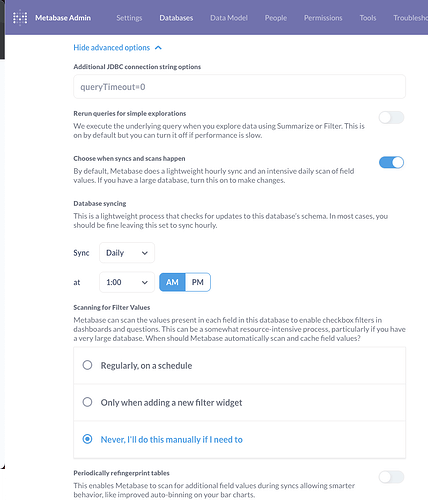
DB Config: