Hello,
I'm having an issue with my Metabase server. The server has been up for several months with no issue but starting this week one of the database connections starting randomly timing out on all reports and tables. It would attempt to load the report or table and then stop after 2 minutes, which I'm assuming is the global timeout setting. It would remain in this state until I took one of the preventative steps listed below. To me the root issue seems to be that it cannot make the connection to the database at random and when that happens the connection is never able to be made again. The Metabase logs don't indicate the precise problem however, which is why I'm reaching out.
Things I tried:
- Rebooting the docker container. This fixed it for a few minutes, meaning I could run reports, but eventually it started timing out again after a short amount of time
- Upgrading to the latest version of Metabase. Same result as above
- Updating the connection string on the database by forcing it to resave. Did not work on the first attempt but got the same result as above on the second attempt
- Changed the "This is a large database, so let me choose when Metabase syncs and scans" setting on the database to be enabled and set it to run once a day. Same result as above
- Rebooting the postgres server. No change
- Did a "Sync database schema now" and "re-scan field values now". No change
Helpful information:
- I analyzed the CPU and memory usage and both are within normal ranges
- I ran a trace on the MS SQL database that the reports are pulling from. No activity showed from Metabase
- I analyzed the Metabase logs. Those are listed below. Line 1 is me running a report and by line 5, where it says ASYNC: canceled, it has timed out after two minutes
- This is only happening for one database on our server. The other databases are unaffected.
[a1374753-bd2d-4c0b-ae48-07a0651bcc7d] 2021-04-30T13:10:04-04:00 DEBUG metabase.server.middleware.log GET /api/dashboard/63 200 46.1 ms (26 DB calls) App DB connections: 0/15 Jetty threads: 3/50 (3 idle, 0 queued) (422 total active threads) Queries in flight: 4 (0 queued)
[a1374753-bd2d-4c0b-ae48-07a0651bcc7d] 2021-04-30T13:10:04-04:00 DEBUG metabase.server.middleware.log GET /api/table/349/query_metadata 200 16.9 ms (9 DB calls) App DB connections: 1/15 Jetty threads: 5/50 (2 idle, 0 queued) (422 total active threads) Queries in flight: 4 (0 queued)
[a1374753-bd2d-4c0b-ae48-07a0651bcc7d] 2021-04-30T13:10:04-04:00 DEBUG metabase.server.middleware.log GET /api/table/347/query_metadata 200 12.9 ms (8 DB calls) App DB connections: 1/15 Jetty threads: 5/50 (2 idle, 0 queued) (422 total active threads) Queries in flight: 4 (0 queued)
[a1374753-bd2d-4c0b-ae48-07a0651bcc7d] 2021-04-30T13:10:04-04:00 DEBUG metabase.server.middleware.log GET /api/table/348/query_metadata 200 11.4 ms (8 DB calls) App DB connections: 0/15 Jetty threads: 5/50 (2 idle, 0 queued) (422 total active threads) Queries in flight: 4 (0 queued)
[a1374753-bd2d-4c0b-ae48-07a0651bcc7d] 2021-04-30T13:12:04-04:00 DEBUG metabase.server.middleware.log POST /api/card/415/query 202 [ASYNC: canceled] 2.0 mins (9 DB calls) App DB connections: 0/15 Jetty threads: 2/50 (11 idle, 0 queued) (447 total active threads) Queries in flight: 16 (0 queued)
[a1374753-bd2d-4c0b-ae48-07a0651bcc7d] 2021-04-30T13:12:04-04:00 DEBUG metabase.server.middleware.log POST /api/card/913/query 202 [ASYNC: canceled] 2.0 mins (11 DB calls) App DB connections: 0/15 Jetty threads: 2/50 (11 idle, 0 queued) (447 total active threads) Queries in flight: 16 (0 queued)
[a1374753-bd2d-4c0b-ae48-07a0651bcc7d] 2021-04-30T13:12:04-04:00 DEBUG metabase.server.middleware.log POST /api/card/914/query 202 [ASYNC: canceled] 2.0 mins (9 DB calls) App DB connections: 0/15 Jetty threads: 3/50 (11 idle, 0 queued) (447 total active threads) Queries in flight: 14 (0 queued)
[a1374753-bd2d-4c0b-ae48-07a0651bcc7d] 2021-04-30T13:12:04-04:00 DEBUG metabase.server.middleware.log POST /api/card/919/query 202 [ASYNC: canceled] 2.0 mins (9 DB calls) App DB connections: 0/15 Jetty threads: 2/50 (11 idle, 0 queued) (447 total active threads) Queries in flight: 12 (0 queued)
[a1374753-bd2d-4c0b-ae48-07a0651bcc7d] 2021-04-30T13:12:04-04:00 DEBUG metabase.server.middleware.log POST /api/card/916/query 202 [ASYNC: canceled] 2.0 mins (11 DB calls) App DB connections: 0/15 Jetty threads: 3/50 (11 idle, 0 queued) (447 total active threads) Queries in flight: 12 (0 queued)
[a1374753-bd2d-4c0b-ae48-07a0651bcc7d] 2021-04-30T13:12:04-04:00 DEBUG metabase.server.middleware.log POST /api/card/928/query 202 [ASYNC: canceled] 2.0 mins (11 DB calls) App DB connections: 0/15 Jetty threads: 2/50 (11 idle, 0 queued) (447 total active threads) Queries in flight: 11 (0 queued)
[a1374753-bd2d-4c0b-ae48-07a0651bcc7d] 2021-04-30T13:12:04-04:00 DEBUG metabase.server.middleware.log POST /api/card/423/query 202 [ASYNC: canceled] 2.0 mins (11 DB calls) App DB connections: 0/15 Jetty threads: 2/50 (11 idle, 0 queued) (447 total active threads) Queries in flight: 9 (0 queued)
[a1374753-bd2d-4c0b-ae48-07a0651bcc7d] 2021-04-30T13:12:04-04:00 DEBUG metabase.server.middleware.log POST /api/card/386/query 202 [ASYNC: canceled] 2.0 mins (11 DB calls) App DB connections: 0/15 Jetty threads: 2/50 (11 idle, 0 queued) (447 total active threads) Queries in flight: 9 (0 queued)
[a1374753-bd2d-4c0b-ae48-07a0651bcc7d] 2021-04-30T13:12:04-04:00 DEBUG metabase.server.middleware.log POST /api/card/416/query 202 [ASYNC: canceled] 2.0 mins (9 DB calls) App DB connections: 0/15 Jetty threads: 3/50 (11 idle, 0 queued) (447 total active threads) Queries in flight: 4 (0 queued)
[a1374753-bd2d-4c0b-ae48-07a0651bcc7d] 2021-04-30T13:12:04-04:00 DEBUG metabase.server.middleware.log POST /api/card/417/query 202 [ASYNC: canceled] 2.0 mins (9 DB calls) App DB connections: 0/15 Jetty threads: 3/50 (11 idle, 0 queued) (447 total active threads) Queries in flight: 4 (0 queued)
[a1374753-bd2d-4c0b-ae48-07a0651bcc7d] 2021-04-30T13:12:04-04:00 DEBUG metabase.server.middleware.log POST /api/card/912/query 202 [ASYNC: canceled] 2.0 mins (9 DB calls) App DB connections: 0/15 Jetty threads: 3/50 (11 idle, 0 queued) (447 total active threads) Queries in flight: 4 (0 queued)
[a1374753-bd2d-4c0b-ae48-07a0651bcc7d] 2021-04-30T13:12:04-04:00 DEBUG metabase.server.middleware.log POST /api/card/917/query 202 [ASYNC: canceled] 2.0 mins (11 DB calls) App DB connections: 0/15 Jetty threads: 3/50 (11 idle, 0 queued) (447 total active threads) Queries in flight: 4 (0 queued)
[a1374753-bd2d-4c0b-ae48-07a0651bcc7d] 2021-04-30T13:12:04-04:00 DEBUG metabase.server.middleware.log POST /api/card/918/query 202 [ASYNC: canceled] 2.0 mins (11 DB calls) App DB connections: 0/15 Jetty threads: 3/50 (11 idle, 0 queued) (447 total active threads) Queries in flight: 4 (0 queued)
Hi @efrederick
Please post "Diagnostic Info" from Admin > Troubleshooting, and which database you are querying.
The "ASYNC: canceled" happens when there's no connection between Metabase and the browser client - in this case, it's very likely caused by a reverse-proxy that has a timeout of 120 seconds.
Here is the diagnostic info:
{
"browser-info": {
"language": "en-US",
"platform": "Win32",
"userAgent": "Mozilla/5.0 (Windows NT 10.0; Win64; x64) AppleWebKit/537.36 (KHTML, like Gecko) Chrome/90.0.4430.85 Safari/537.36",
"vendor": "Google Inc."
},
"system-info": {
"file.encoding": "UTF-8",
"java.runtime.name": "OpenJDK Runtime Environment",
"java.runtime.version": "11.0.11+9",
"java.vendor": "AdoptOpenJDK",
"java.vendor.url": "https://adoptopenjdk.net/",
"java.version": "11.0.11",
"java.vm.name": "OpenJDK 64-Bit Server VM",
"java.vm.version": "11.0.11+9",
"os.name": "Linux",
"os.version": "4.4.0-1117-aws",
"user.language": "en",
"user.timezone": "GMT"
},
"metabase-info": {
"databases": [
"sqlserver",
"h2"
],
"hosting-env": "unknown",
"application-database": "postgres",
"application-database-details": {
"database": {
"name": "PostgreSQL",
"version": "12.5"
},
"jdbc-driver": {
"name": "PostgreSQL JDBC Driver",
"version": "42.2.18"
}
},
"run-mode": "prod",
"version": {
"date": "2021-04-27",
"tag": "v0.39.1",
"branch": "release-x.39.x",
"hash": "6beba48"
},
"settings": {
"report-timezone": null
}
}
}
I am querying an MS SQL database. This metabase server is up in AWS behind an application load balancer. I can check the logs up there and see if there's anything related to a timeout
@efrederick
How many instances are you running behind ALB - just one or multiple?
How long time do these queries normally take? Like if you just run a single question by itself.
It looks like the queries are queuing up, but perhaps they aren't actually being sent, when it was cancelled.
I'm not sure why, but it seems like you're missing stacktraces, when the query is cancelled, which should have more information about where it was cancelled.
Otherwise your browser developer Network-tab should get a response back from one of the cancelled requests, which might have a header to indicate what killed the connection.
And I don't know how many connections are open to your MSSQL, but check that:
https://stackoverflow.com/questions/1248423/how-do-i-see-active-sql-server-connections
Metabase only opens up to 15 connections to each database configured, which can be configured, but it sounds like you're hitting a different problem, so we'll ignore that for now.
We might have to enable some debug logging - we are adding a lot more logging in upcoming versions, so it's easier to debug problems like this (some of it will only land in 0.40)
We just have one instance behind our ALB. Most of the queries return just about instantly. After I rebooted the server last time I was able to click around on about 20 different reports and all came up in under a second then just randomly stopped.
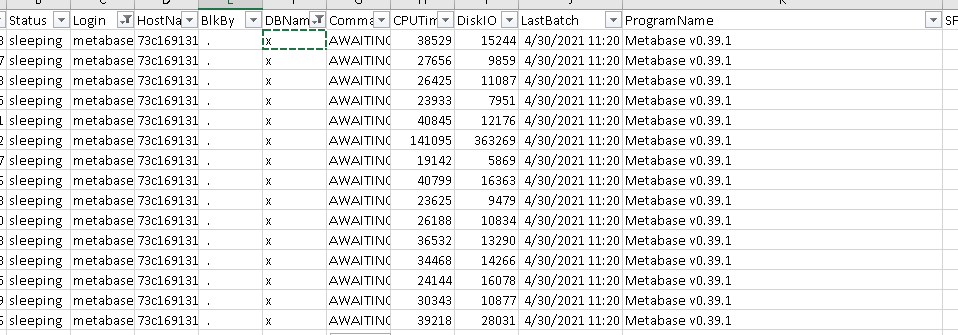
I ran the sp_who2 and I see 14 sleeping connections from metabase to this SQL database.
I was looking into adding a more detailed level of tracing, as it seems it's currently just set to debug and not debug+tracing. I was having issues finding out how to change that. Would that provide the additional info you're looking for?
@efrederick When were the connections opened, when was last query and how long have they been sleeping for?
I would just leave the standard logging - it's better than what you seem to have configured right now.
@efrederick I have no idea when this was executed, so it doesn't tell me how long the connection has been sleeping. It should close idle connections after 5 minutes, but it seems like it's being kept alive.
If you run a simple select 1 - does it reuse one of the sleeping connections or start a new?
This is the root problem - not all the ALB, CPU, RAM etc
The last batch is when the thread was started, so that would be 11:20 EST today. I upgraded the server at around 11:10 and had our client log in right around that time to test. I'll try the select 1 and let you know how it goes
@efrederick Wait, so you're saying that those have been idle for 4.5 hours?
I don't think any queries will work - specially not if you visit the dashboard.
You would likely need to restart, and then try to redo the exact steps the client did, while you preserve all the logs and connection stats.
Select 1 failed. It just spun until it timed out. I went ahead and killed a number of metabase processes to bring the total # down to less than 15, as a test, but that didn't change anything on the front end
@efrederick Hmmmm.... post your Metabase logs.
This is all that shows up in the logs if I do a Select 1:
[a1374753-bd2d-4c0b-ae48-07a0651bcc7d] 2021-04-30T16:11:20-04:00 DEBUG metabase.server.middleware.log GET /api/database/2/autocomplete_suggestions 200 27.4 ms (6 DB calls) App DB connections: 0/15 Jetty threads: 3/50 (17 idle, 0 queued) (765 total active threads) Queries in flight: 10 (0 queued)
[a1374753-bd2d-4c0b-ae48-07a0651bcc7d] 2021-04-30T16:11:21-04:00 DEBUG metabase.server.middleware.log GET /api/database/2/autocomplete_suggestions 200 9.0 ms (5 DB calls) App DB connections: 0/15 Jetty threads: 3/50 (17 idle, 0 queued) (765 total active threads) Queries in flight: 10 (0 queued)
[a1374753-bd2d-4c0b-ae48-07a0651bcc7d] 2021-04-30T16:13:42-04:00 DEBUG metabase.server.middleware.log GET /api/user/current 200 2.8 ms (3 DB calls) App DB connections: 0/15 Jetty threads: 3/50 (15 idle, 0 queued) (761 total active threads) Queries in flight: 11 (0 queued)
[a1374753-bd2d-4c0b-ae48-07a0651bcc7d] 2021-04-30T16:13:42-04:00 DEBUG metabase.server.middleware.log GET /api/session/properties 200 3.3 ms (2 DB calls) App DB connections: 0/15 Jetty threads: 3/50 (15 idle, 0 queued) (761 total active threads) Queries in flight: 11 (0 queued)
[a1374753-bd2d-4c0b-ae48-07a0651bcc7d] 2021-04-30T16:13:42-04:00 DEBUG metabase.server.middleware.log GET /api/database 200 6.9 ms (3 DB calls) App DB connections: 0/15 Jetty threads: 3/50 (15 idle, 0 queued) (761 total active threads) Queries in flight: 11 (0 queued)
I'm signing off for the day but I will keep checking this thread if I get a chance on the weekend for things to try if I have a minute. If not, I'll check back in on Monday. Thanks!
@efrederick The problem is that there's "Queries in flight: 10", which is why it isn't releasing. I'll try to debug a bit, but I know what the problem is and it's something we're actively working on fixing - just the first time I've seen this problem with MSSQL.
For reference: https://github.com/metabase/metabase/issues/8679
Good morning! So if this is a known bug, do you know what the timeline is for a fix? Is this a bug only in the free version or does Enterprise experience this as well? We are planning on moving to Enterprise in the very near future
@efrederick This affects all editions of Metabase, but it has been extremely difficult to reproduce, so if you can provide information which will help with that, then we can fix the issue - otherwise the timeline might span for a very long time.
I'd be happy to provide you with whatever you need. I have the log data above. Is there anything else you need that will help you? This issue didn't start happening until early last week. I had upgraded to version 0.38 in early April I believe and I am not sure if our client was using Metabase in the weeks prior to that.
@efrederick From what I can tell, this issue has been around for a long time, but requires some weird combination to trigger the problem.
We currently think that it has something to do with a fringe problem on AWS (ECS) together with load-balancer, which somehow keeps the connections hanging.
It would be great if you can restart the instance, and then reproduce exactly what your client did, so it triggers the problem consistently (consistently meaning, that if you follow your exact steps again, then you can reproduce the problem every time).
And provide all the logs, and steps you did. Also the session status would be helpful:
SELECT spid, login_time, last_batch, status, cmd, program_name, CURRENT_TIMESTAMP
FROM sys.sysprocesses
WHERE program_name  LIKE 'Metabase%'
While even with this information, it might not be possible for us to reproduce, but then we can create a debug build for you, which should be able to provide enough information for us to finally fix the root cause.