@matusp Check the Metabase application database databasechangelog.id=381 for exec_type
Make sure that you actually have an index for query_execution.card_id called idx_query_execution_card_id
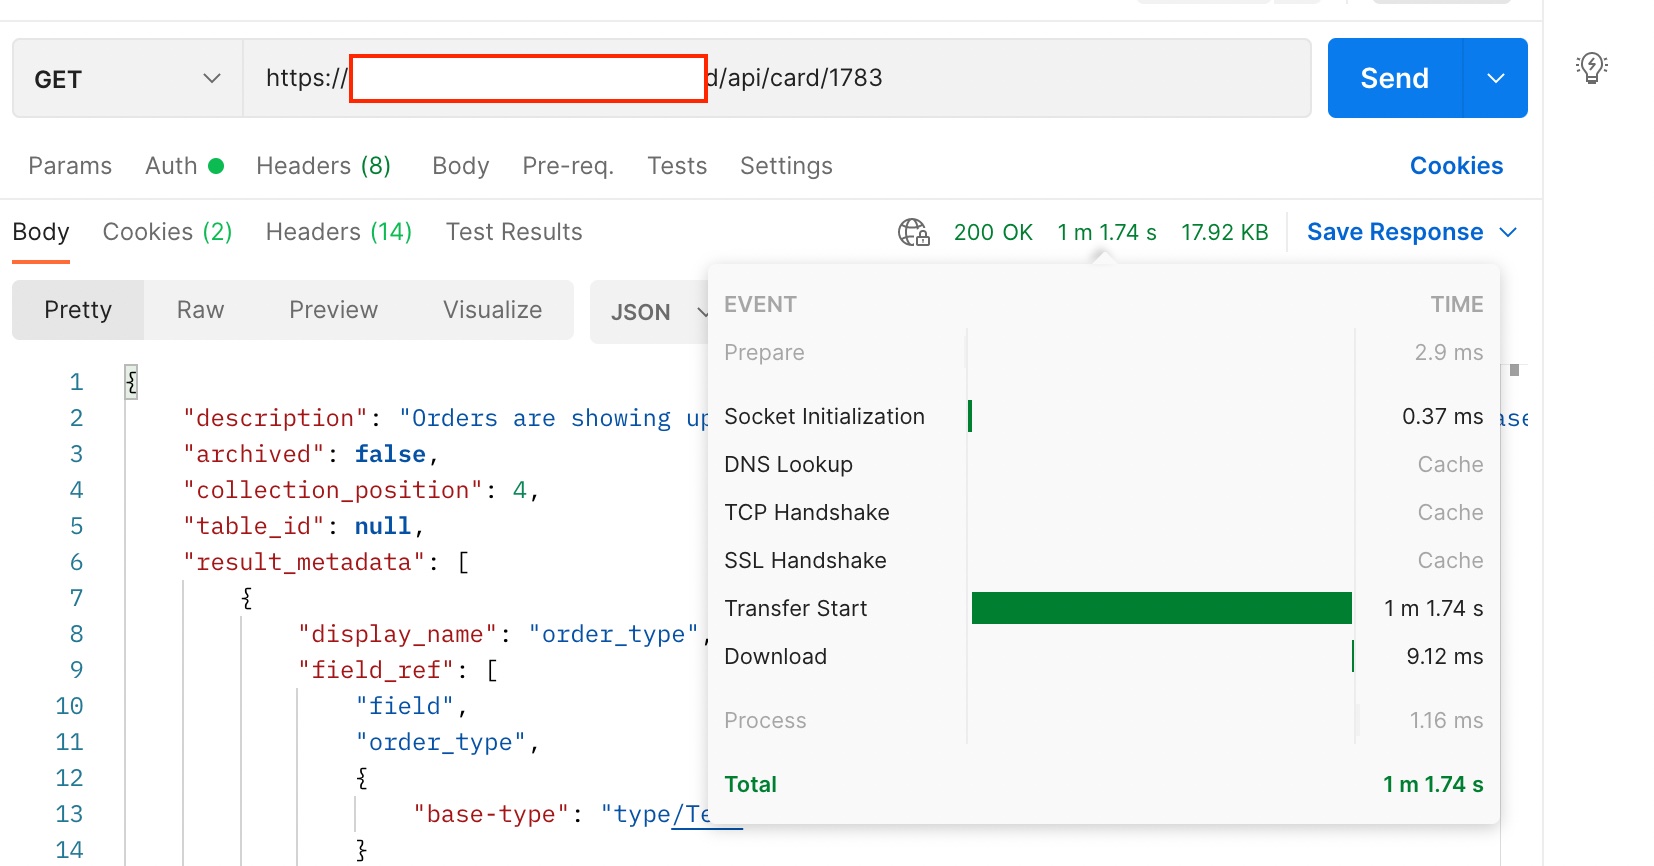
Otherwise you might need to look in your Postgres database query logs and run a EXPLAIN ANALYZE on the queries being executed, when accessing /api/card/1783
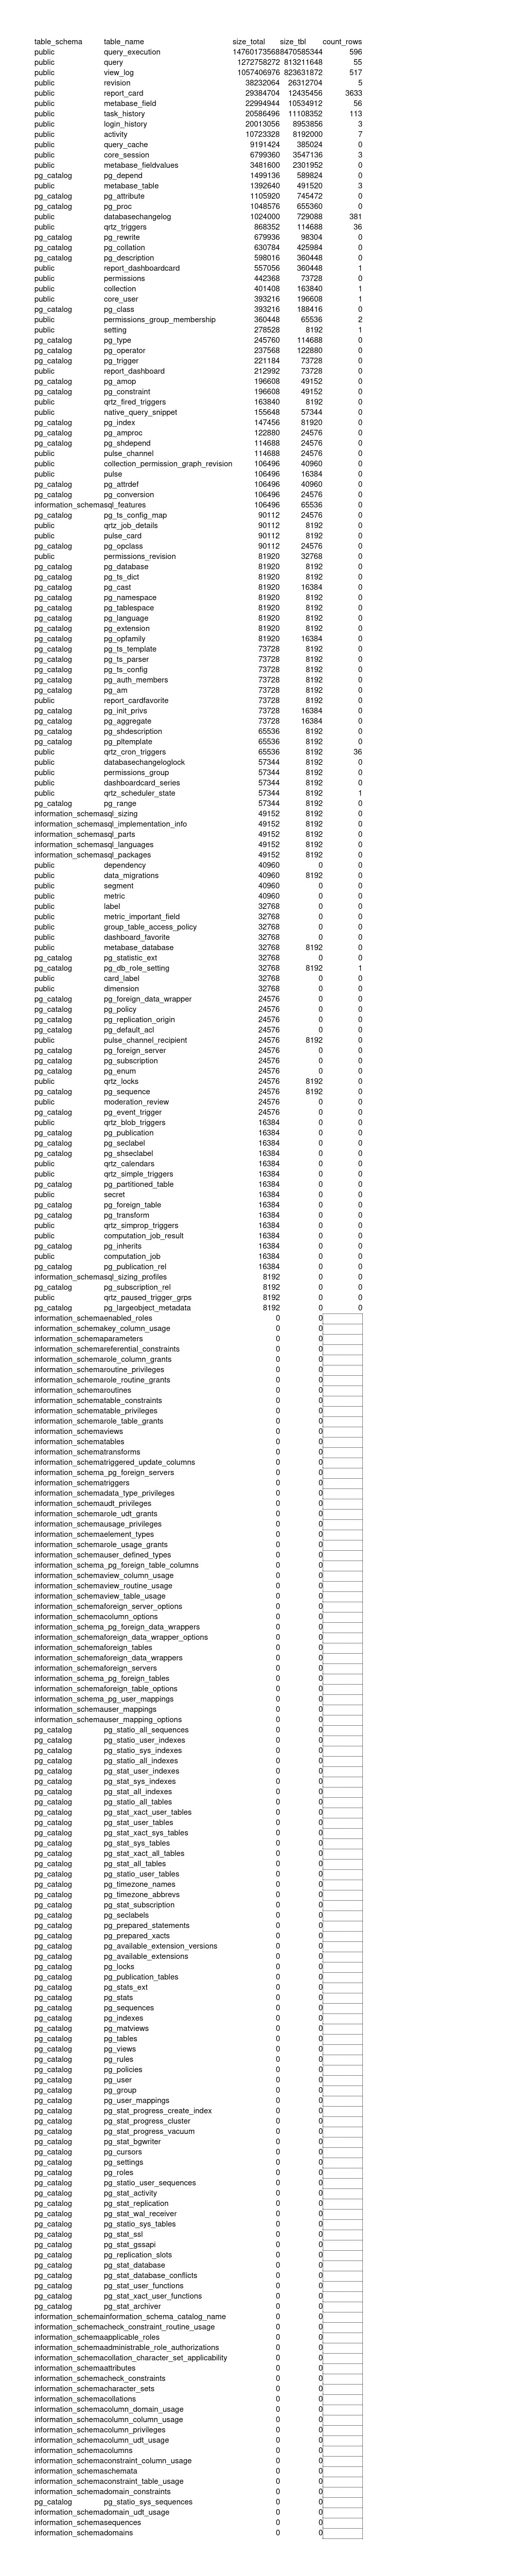
@matusp While you're looking into queries, can you provide some numbers about your setup - specifically the row count of your tables
with tbl as (select table_schema, table_name from information_schema.tables where table_name not like 'pg_%' and table_schema != 'information_schema' and table_schema in ('public')) --change 'public' if Metabase appdb is in another schema
select
  table_schema
  , table_name
  , pg_total_relation_size('"'||table_schema||'"."'||table_name||'"') size_total
  , pg_relation_size('"'||table_schema||'"."'||table_name||'"') size_tbl
  , (xpath('/row/c/text()', query_to_xml(format('select count(*) as c from %I.%I', table_schema, table_name), false, true, '')))[1]::text::bigint count_rows
from tbl
order by 5 desc nulls last;
@flamber Here are the queries that we identified as those that were triggered, and their EXPLAIN ANALYZE.
metabase=> EXPLAIN ANALYZE SELECT * FROM "report_card" WHERE "id" = 1783 LIMIT 1;
                                                             QUERY PLAN
-------------------------------------------------------------------------------------------------------------------------------------
 Limit  (cost=0.28..8.30 rows=1 width=1533) (actual time=0.019..0.020 rows=1 loops=1)
   ->  Index Scan using pk_report_card on report_card  (cost=0.28..8.30 rows=1 width=1533) (actual time=0.018..0.018 rows=1 loops=1)
         Index Cond: (id = 1783)
 Planning Time: 0.685 ms
 Execution Time: 0.067 ms
(5 rows)
metabase=> EXPLAIN ANALYZE SELECT count(*) AS "count" FROM "report_dashboardcard" WHERE "card_id" = 1783 LIMIT 1
metabase-> ;
                                                                            QUERY PLAN
------------------------------------------------------------------------------------------------------------------------------------------------------------------
 Limit  (cost=13.64..13.65 rows=1 width=8) (actual time=0.022..0.023 rows=1 loops=1)
   ->  Aggregate  (cost=13.64..13.65 rows=1 width=8) (actual time=0.021..0.022 rows=1 loops=1)
         ->  Index Only Scan using idx_dashboardcard_card_id on report_dashboardcard  (cost=0.28..13.63 rows=4 width=0) (actual time=0.016..0.019 rows=4 loops=1)
               Index Cond: (card_id = 1783)
               Heap Fetches: 4
 Planning Time: 0.169 ms
 Execution Time: 0.055 ms
(7 rows)
metabase=> EXPLAIN ANALYZE SELECT avg("running_time") FROM "query_execution" WHERE ("running_time" IS NOT NULL AND "cache_hit" <> TRUE AND "card_id" = 1783);
                                                                         QUERY PLAN
------------------------------------------------------------------------------------------------------------------------------------------------------------
 Finalize Aggregate  (cost=1305989.21..1305989.22 rows=1 width=32) (actual time=73862.329..73862.702 rows=1 loops=1)
   ->  Gather  (cost=1305988.99..1305989.20 rows=2 width=32) (actual time=73860.805..73862.682 rows=3 loops=1)
         Workers Planned: 2
         Workers Launched: 2
         ->  Partial Aggregate  (cost=1304988.99..1304989.00 rows=1 width=32) (actual time=73856.824..73856.825 rows=1 loops=3)
               ->  Parallel Seq Scan on query_execution  (cost=0.00..1303647.98 rows=536404 width=4) (actual time=17600.196..73777.251 rows=323347 loops=3)
                     Filter: ((running_time IS NOT NULL) AND (NOT cache_hit) AND (card_id = 1783))
                     Rows Removed by Filter: 16932989
 Planning Time: 0.327 ms
 Execution Time: 73862.743 ms
(10 rows)
metabase=> EXPLAIN ANALYZE SELECT max("started_at") FROM "query_execution" WHERE ("running_time" IS NOT NULL AND "cache_hit" <> TRUE AND "card_id" = 1783);
                                                                                    QUERY PLAN
-----------------------------------------------------------------------------------------------------------------------------------------------------------------------------------
 Result  (cost=2.61..2.62 rows=1 width=8) (actual time=0.060..0.061 rows=1 loops=1)
   InitPlan 1 (returns $0)
     ->  Limit  (cost=0.56..2.61 rows=1 width=8) (actual time=0.057..0.058 rows=1 loops=1)
           ->  Index Scan Backward using idx_query_execution_started_at on query_execution  (cost=0.56..2637165.10 rows=1287369 width=8) (actual time=0.057..0.057 rows=1 loops=1)
                 Index Cond: (started_at IS NOT NULL)
                 Filter: ((running_time IS NOT NULL) AND (NOT cache_hit) AND (card_id = 1783))
                 Rows Removed by Filter: 149
 Planning Time: 0.216 ms
 Execution Time: 0.092 ms
metabase=> SELECT
metabase->     tablename,
metabase->     indexname,
metabase->     indexdef
metabase-> FROM
metabase->     pg_indexes
metabase->     where tablename = 'query_execution';
    tablename    |                 indexname                 |                                                    indexdef
-----------------+-------------------------------------------+-----------------------------------------------------------------------------------------------------------------
 query_execution | pk_query_execution                        | CREATE UNIQUE INDEX pk_query_execution ON public.query_execution USING btree (id)
 query_execution | idx_query_execution_query_hash_started_at | CREATE INDEX idx_query_execution_query_hash_started_at ON public.query_execution USING btree (started_at)
 query_execution | idx_query_execution_started_at            | CREATE INDEX idx_query_execution_started_at ON public.query_execution USING btree (started_at)
 query_execution | idx_query_execution_card_id_started_at    | CREATE INDEX idx_query_execution_card_id_started_at ON public.query_execution USING btree (card_id, started_at)
 query_execution | idx_query_execution_card_id               | CREATE INDEX idx_query_execution_card_id ON public.query_execution USING btree (card_id)
@matusp What's up with your Postgres? It says that there's 596 rows in query_execution, but your explain says there's 17 million rows.
Could it be that it has never been optimized (VACUUM)?
Or perhaps it's running on an instance that doesn't have enough memory to keep the indexes in memory, so it's actually swapping when looking through the indexes?
If you don't need the historical execution data, then you can truncate query_execution or just remove anything older than a month.
Alternative add another index:
CREATE INDEX idx_query_execution_card_id_running_time ON public.query_execution USING btree (card_id, running_time)
In which version did you add calling "SELECT avg("running_time") FROM "query_execution" WHERE.. " every time a report is open? Seems like this wasn't present in 0.40.5 and was added in versions later.
We tried to add index, but it did not help, The query is ignoring all indexes.
metabase=> EXPLAIN ANALYZE SELECT avg("running_time") FROM "query_execution" WHERE ("running_time" IS NOT NULL AND "cache_hit" <> TRUE AND "card_id" = 1783);
QUERY PLAN
---------------------------------------------------------------------------------------------------------------------------------------------------------
Finalize Aggregate (cost=1364121.92..1364121.93 rows=1 width=32) (actual time=145712.603..145731.305 rows=1 loops=1)
-> Gather (cost=1364121.70..1364121.91 rows=2 width=32) (actual time=145691.014..145729.658 rows=3 loops=1)
Workers Planned: 2
Workers Launched: 2
-> Partial Aggregate (cost=1363121.70..1363121.71 rows=1 width=32) (actual time=145676.617..145676.637 rows=1 loops=3)
-> Parallel Seq Scan on query_execution (cost=0.00..1361746.61 rows=550034 width=4) (actual time=2.655..145245.645 rows=340415 loops=3)
Filter: ((running_time IS NOT NULL) AND (NOT cache_hit) AND (card_id = 1783))
Rows Removed by Filter: 17735437
Planning Time: 3.171 ms
Execution Time: 145733.558 ms
(10 rows)
@flamber I only have limited information since there is a lot of DevOps work out of my scope.
But we were able to fix this by adding this index: CREATE INDEX idx_query_execution_card_id_running_time_cache_hit ON public.query_execution USING btree (card_id, running_time, cache_hit)
And we also deleted everything older than 3 months in the query_execution table.