For context, I am running v0.46.6.1, and was not having this issue prior to this version update.
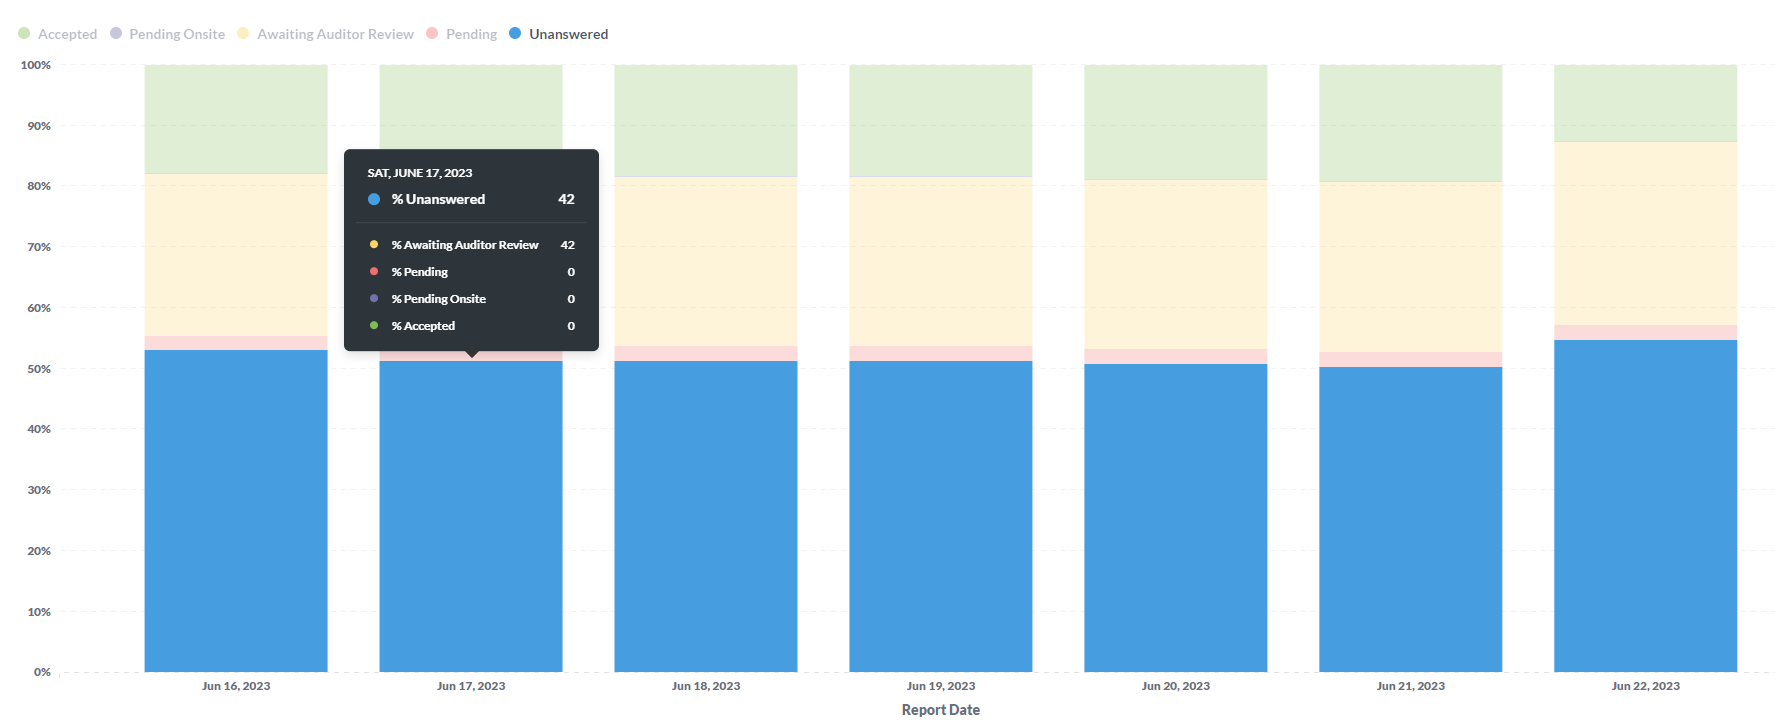
I built a native query that is displayed in a 100% stacked bar chart. The report shows client progress day-over-day, and is divided out by various statuses (Accepted, Pending, Unanswered, etc.). The chart properly shows the percentage of each status for the cumulative clients for each day, but the tooltip when you hover over the chart has two main issues:
The values only represent the first client's numbers for the designated date, when it should be cumulative for all clients on that date.
The tooltip shows the raw numbers instead of the percentages, even though it labels them as percentages (% Pending, % Accepted, etc.). For example, in the screen shot I've included, the date of June 17, 2023 shows zero for Pending and Accepted, but you can clearly see the chart contains data for those statuses on that date.
Has anyone else dealt with this issue? I'm using the open-source version of Metabase and wondered if perhaps it's something you could customize with premium, but looking into it that doesn't seem to be the case. This appears to be a bug, but unfortunately having trouble finding anything about it anywhere else online or getting any traction here. Any help or advice from anyone would be greatly appreciated! @dragonsahead
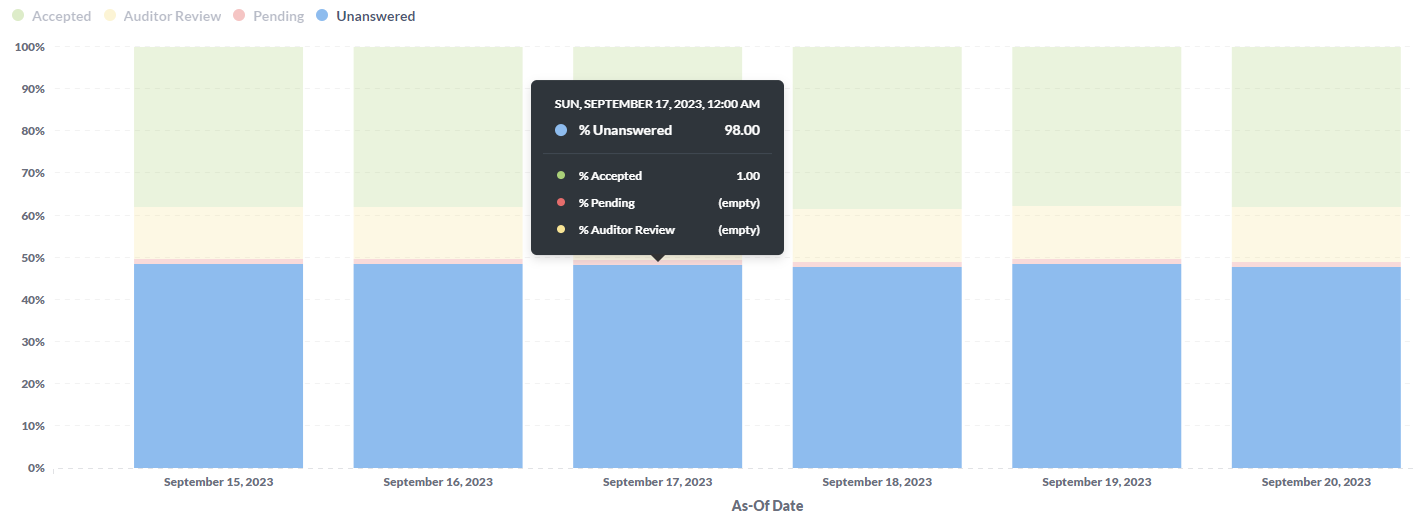
@dragonsahead@Filmon - a quick update - I was able to get the values in the tool tip to display as percentages with some SQL manipulation, so the main and outstanding issue I'm having is that the tool tip only shows the numbers for the first row in the data set. So for this example, I'm only seeing the percentages for one of many projects that are included in the actual visualization. I would like to see the cumulative numbers for all data within a set date.
As you can see below, the tool tip is showing 98% unanswered and 1% accepted, which are the numbers for one single row, whereas the chart itself represents the full data set with closer to 50% unanswered and 35% accepted.
@Filmon and @dragonsahead - Are there any updates on this? I had previously posted it here under
"Get Help" with no luck, so between the two posts I've been waiting about 4 months for assistance with this issue. Any help would be much appreciated. @gembird confirmed he sees the same issue.
Thanks @dragonsahead for the response. Without seeing the results you got with your example I'm not sure what you mean by correct values. To clarify, the values I see are "correct", but only if you're looking at the first row in the raw data set (1 row per project, and then split out by date - each project is updated daily). To clarify some things about my query, I'm querying from a table and joining 3 additional tables, I'm using sum for the values I want to see, but the stacked bar chart is showing the cumulative sum for each column and then showing that as a percentage in the stacked bar when you look at the y axis, but the tool tip is only showing the first project in the data set. I'm guessing the example you're using is less complex, based on how you described it.
@dragonsahead@Filmon, for additional clarification, to get your example closer to what I'm working with, I'd recommend adding multiple product owners, manufacturers, and order status, then sum by order status (received, working, shipped, completed, etc.). Then there could be a variable filter for product owner and manufacturer, and you'd split the order status out by date so you're seeing what the sum of each order status for all orders is over the past 7 days (or however long you choose).
x-axis would be date, and y-axis would be the 100% stacked chart to show status. You'd see the percentage of each status for each day that would include all product IDs, owners, and manufacturers. You'd then use a filter if you wanted to see just the trend for one product ID or one owner, etc.
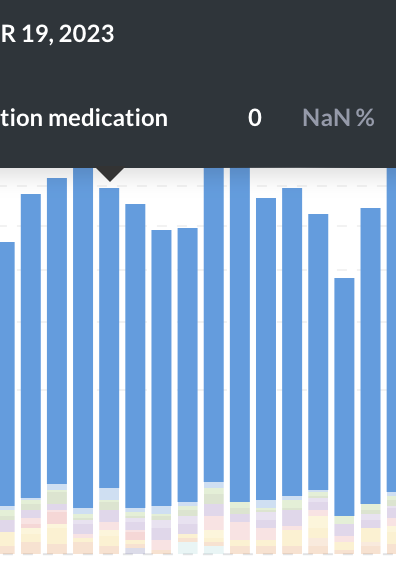
I can confirm that I am having the same problem that @b.penn is describing, although in my case the tooltip issue is occurring on an area graph that is just stacked (not stacked 100%). I have had this issue on both Metabase v0.47.2 and after upgrading to v0.47.6, the latest version as of this writing.
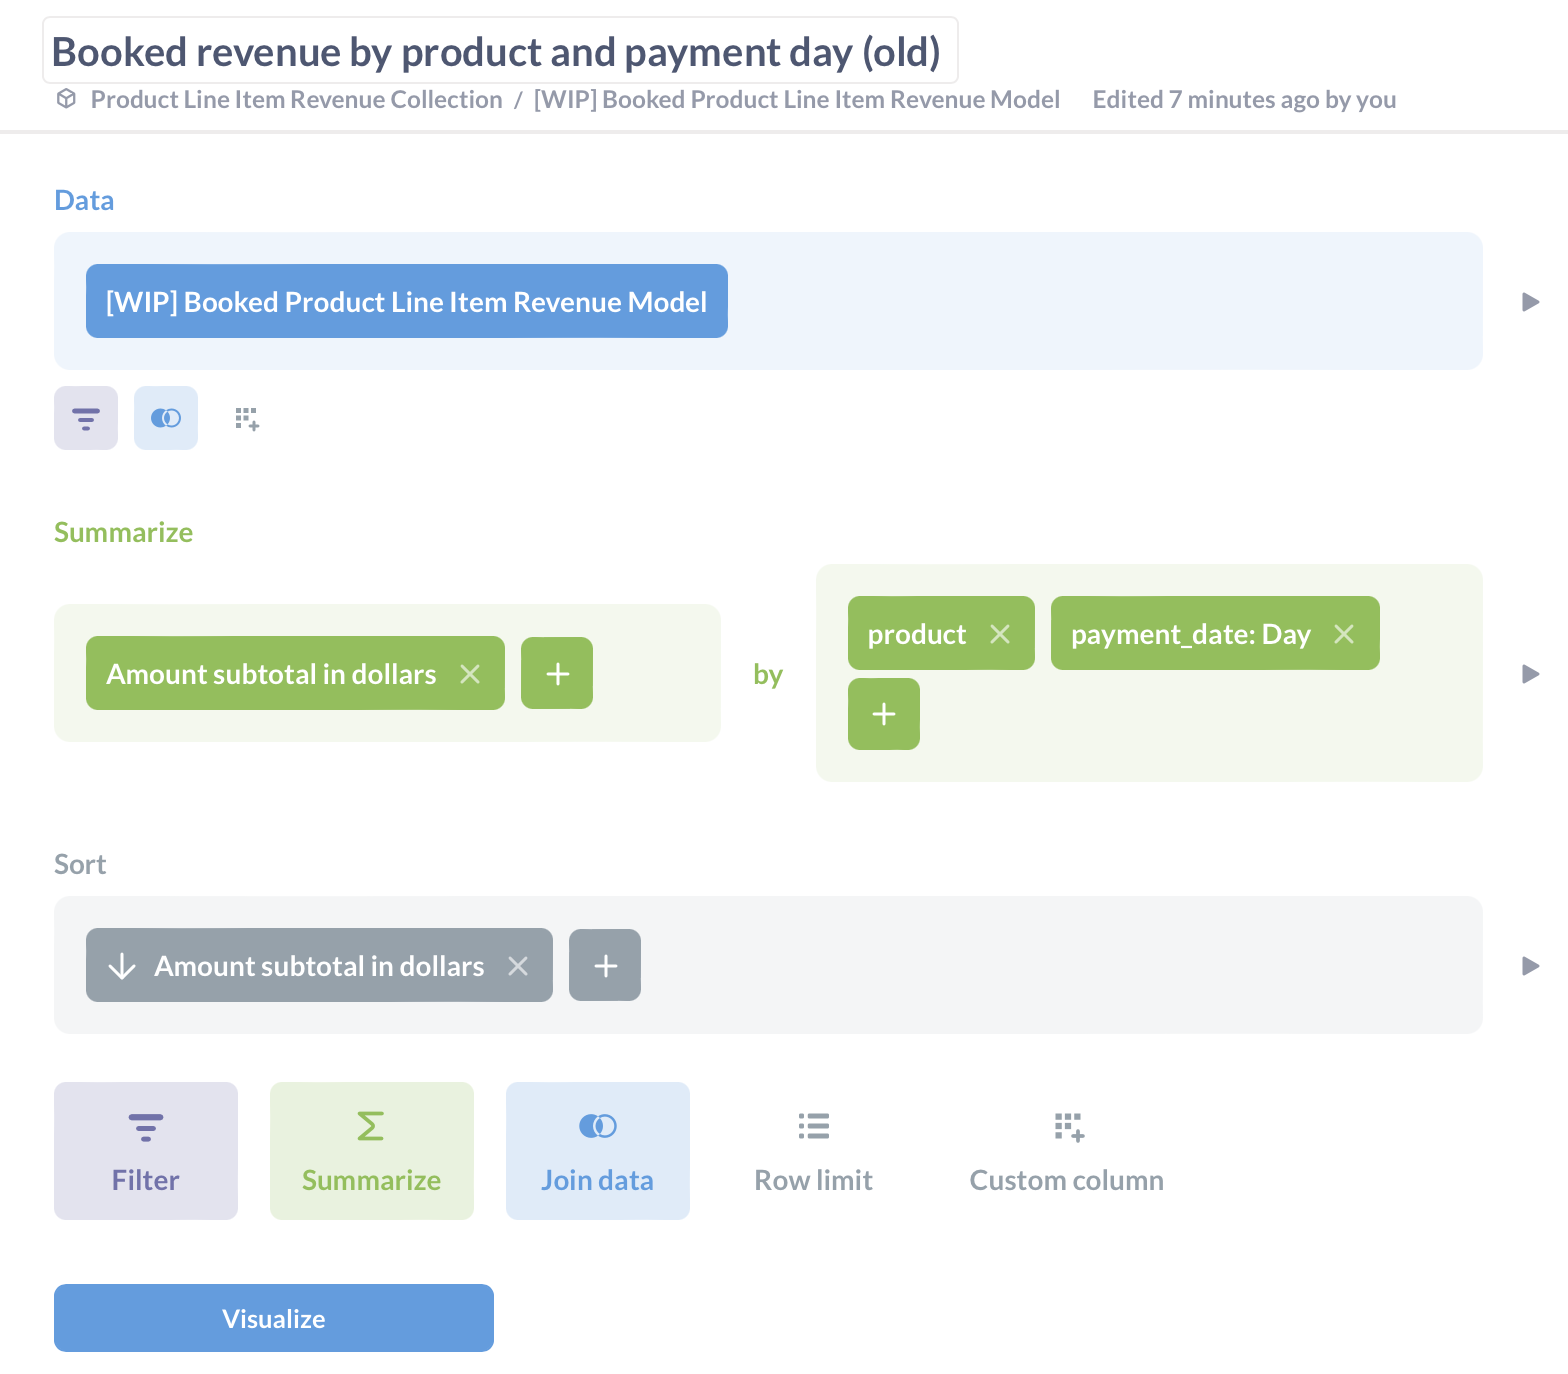
For my failing graph, the question is a native query editor question based on a SQL-based model I've defined. Strangely, I also have an identical question to the one that is failing that does work based off a model derived from the model backing the failing question.
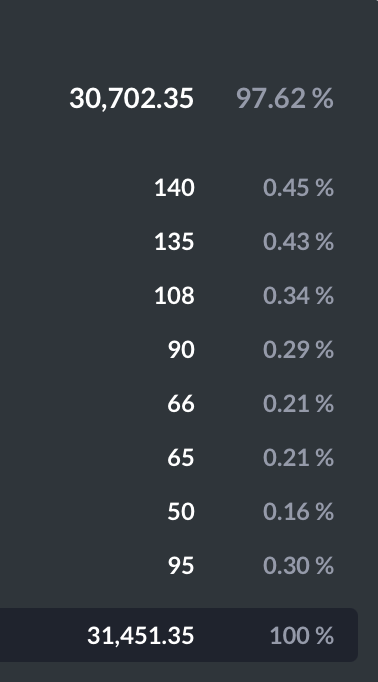
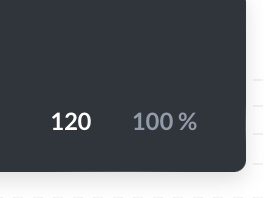
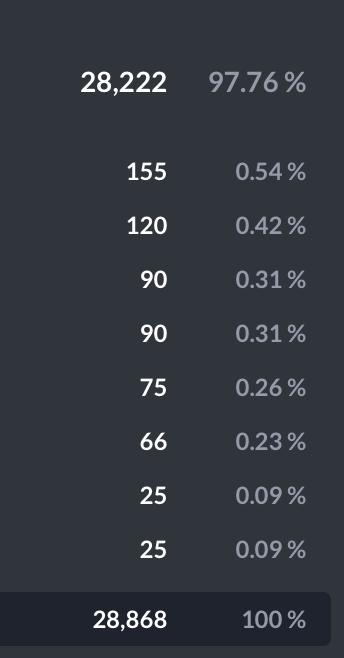
Here is what I see in the tooltip for the question that is not properly working:
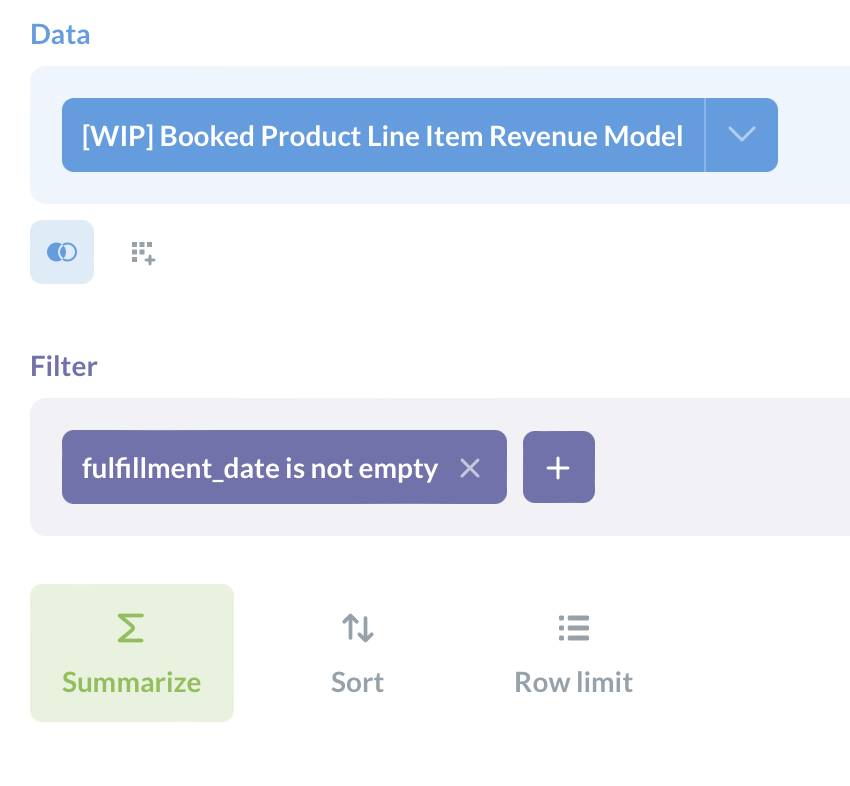
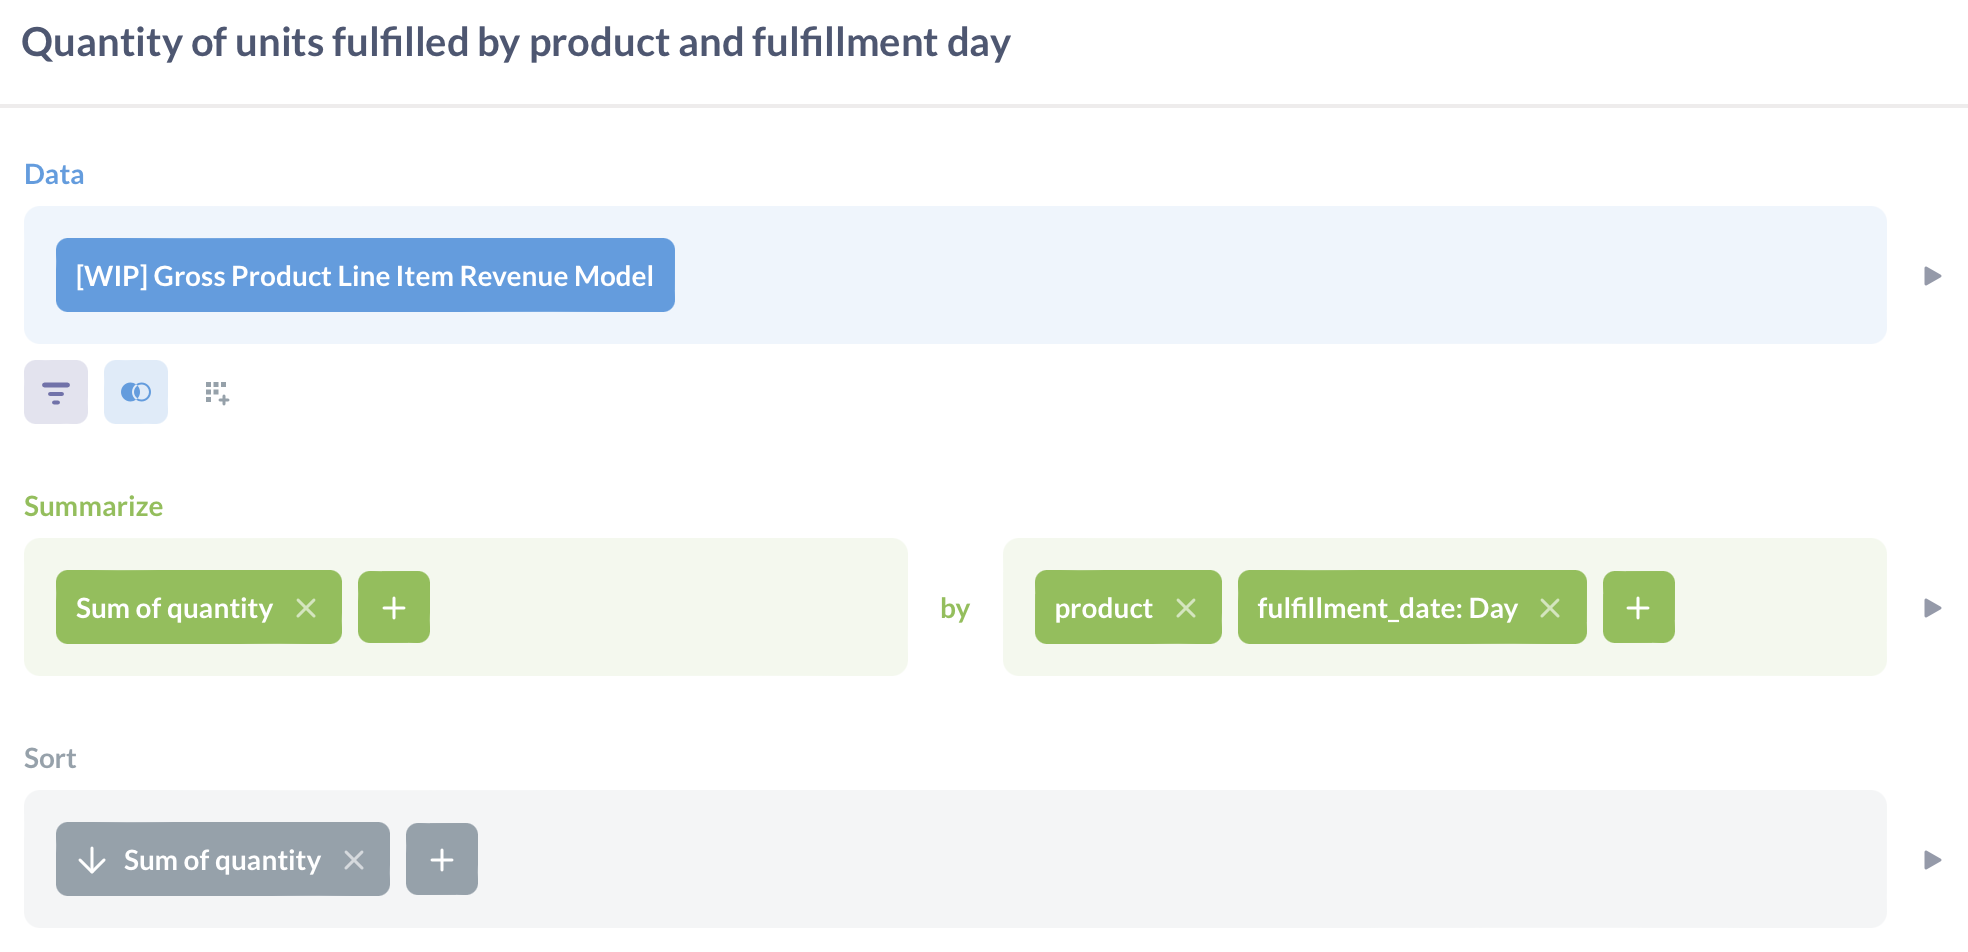
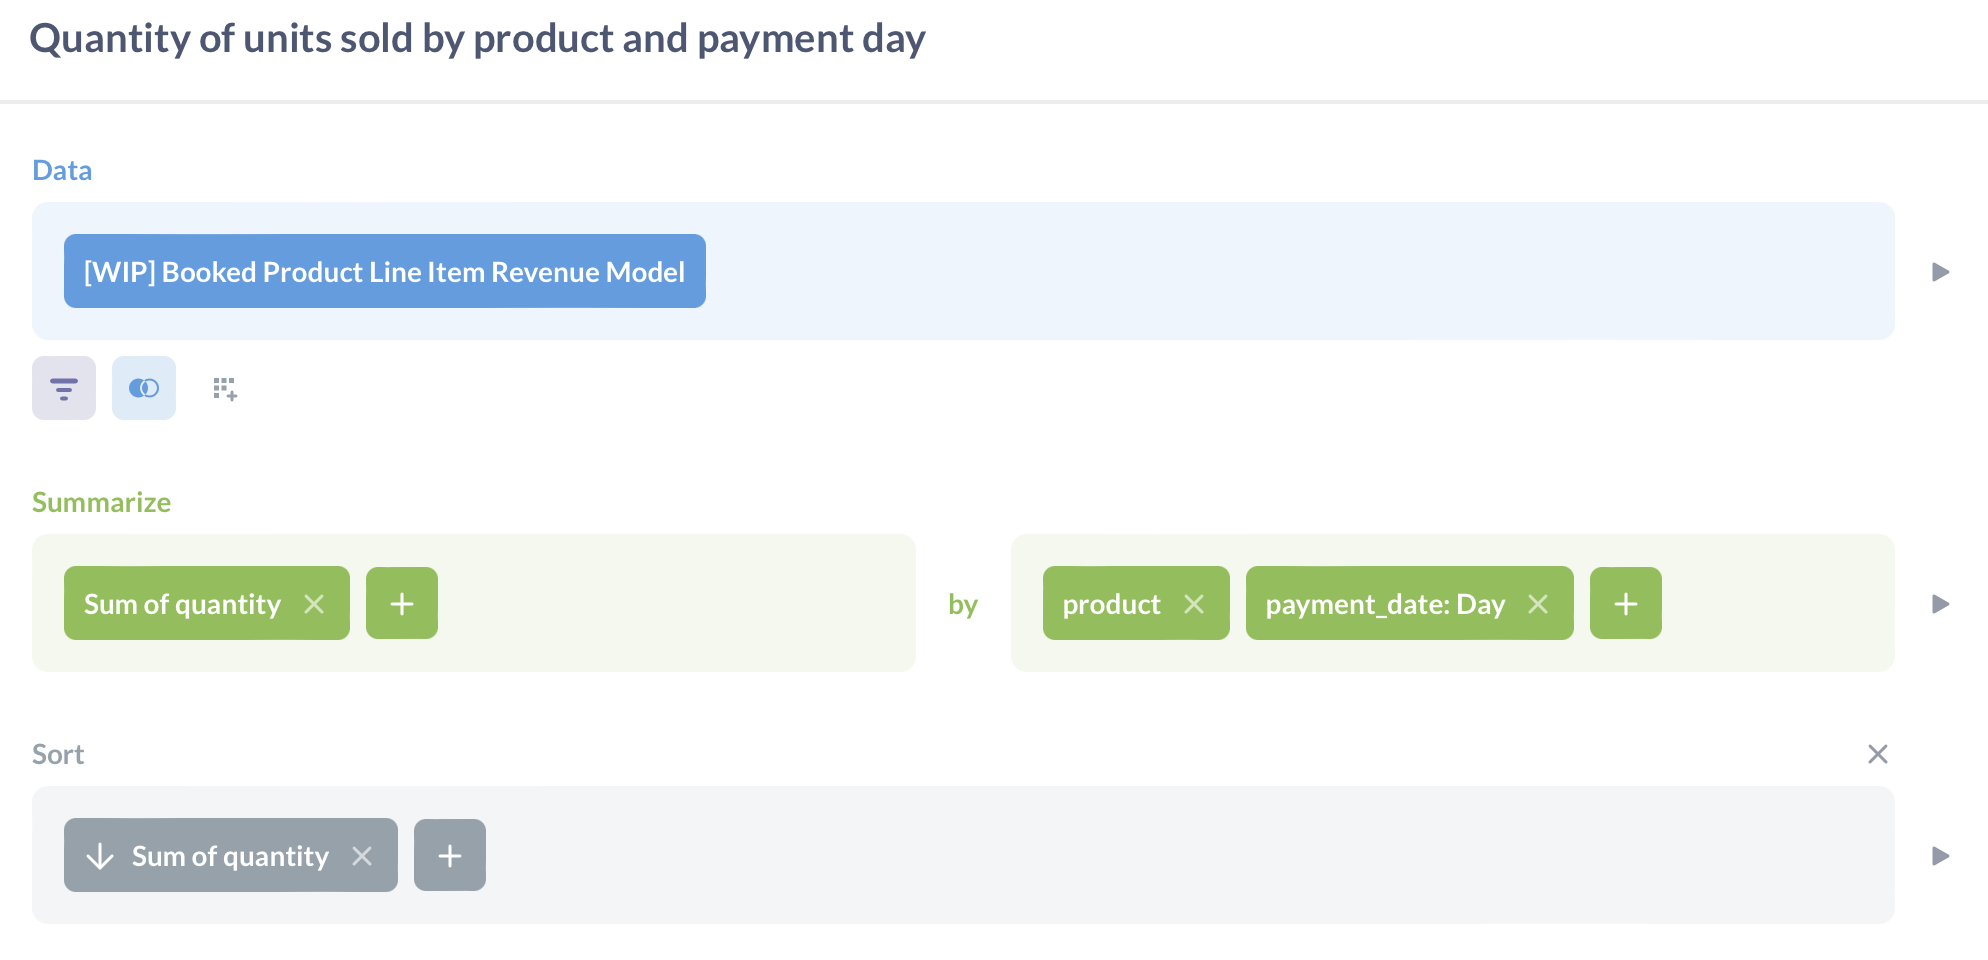
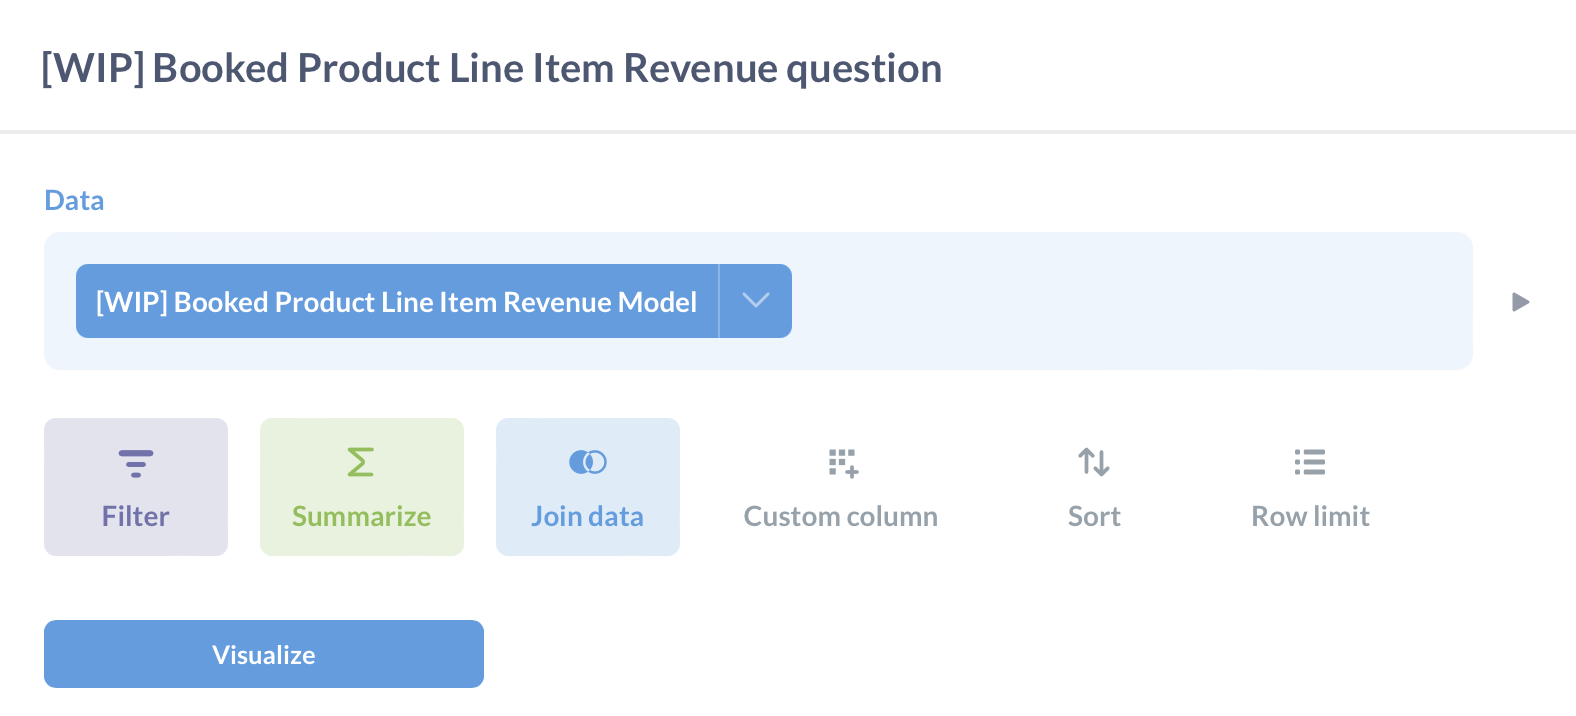
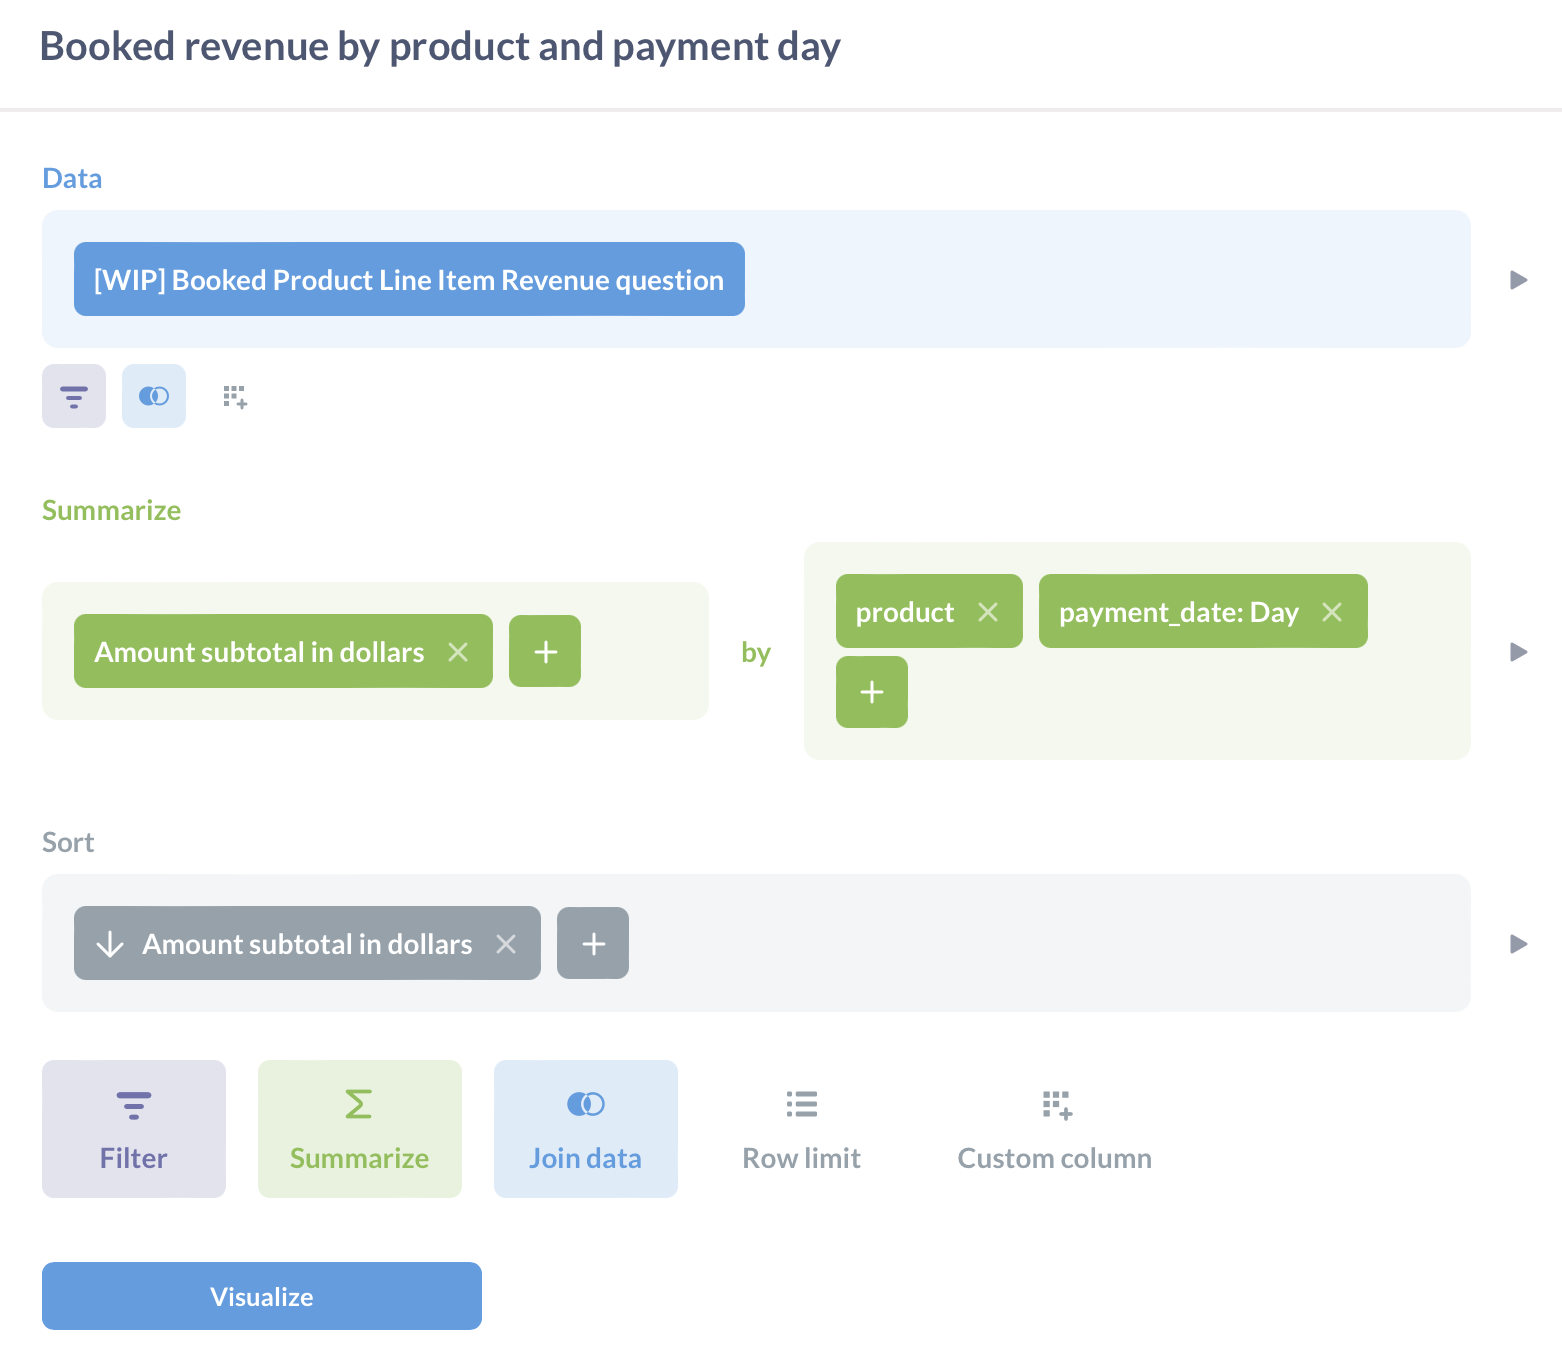
FYI, I've been able to find a workaround for my experience of this issue. This issue was happening for me when I used a model based on a native query, but when I did the exact same output on a model using the query editor GUI, the tooltip stacked properly. So, what I did to workaround this issue was to create a question with the query editor GUI based on my native query model, and then use that question as the base for my visualizations.
In case that explanation was confusing, here's what it looks like in images. Create a question in the query editor GUI: