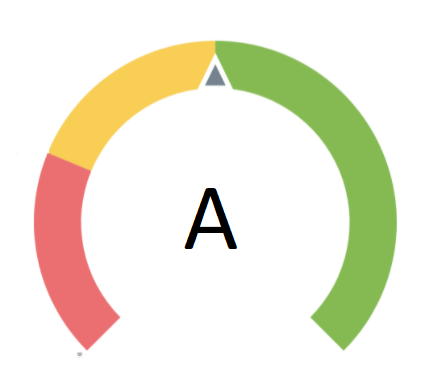
I currently use this to show ABC classification of my inventory. I'm using regions with values ranges (A as green 80% percent, B in yellow 15%, C in red 5%). It would be nice, if we could remove the numbers and maybe show the region name in the middle. Its currently not possible.
Something like this:
Vertical table
I use table to show some article data for a filtered dashboard. (sku,name,ean,..). Its a one row table. It would be nice, if we can flip column to rows.
Mandatory dashboard filters
My article detail dashboard can be quite heavy, when its processing all article data, instead of just one. I've added a article number filter as dashboard filter. It would be nice, if we can set filters to Mandatory, so metabase doesn't process any graphs till a value is set there. Would help to reduce database usage.
Gauge:
I would probably say you are looking for a different visualization that Gauge.
Vertical table:
You are likely looking for something like this: https://github.com/metabase/metabase/issues/4392 - upvote by clicking on the first post
You can also transpose the results via SQL.
@toink Yes, create issues for feature request and bugs on Github. Only a single topic per issue.
And make sure you search before creating new issues, to avoid duplicates.
 on the first post