The dashboard is the live version based on a demo that featured demo data. That's why there are no results yet in each question. Each question has the filters needed to feed into the dashboard filter, but they are not a selectable option (see screenshot). In addition, saving the dashboard fails. Has anyone encountered either of these issues before? (Am using v0.33.6)

Hi @lvdv
Upgrade to 0.33.7.3 - fixes other issues, not related to this.
I’m not sure if the missing filter selection is related to the saving failed, so let’s focus on the latter.
Go and check the Admin > Troubleshooting > Logs for errors, and also check your browser console for errors.
Hi @flamber
Thanks for your response. We've since upgraded to 0.34.1 and the error persists (as expected from your message).
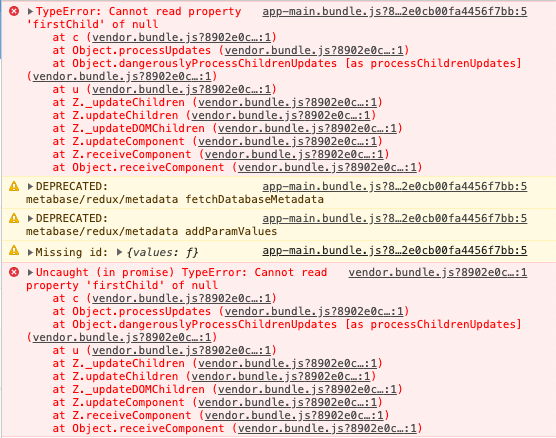
We saw error in the browser console (see screenshot). There were no errors appearing in my Metabase logs. My full user agent string is: Mozilla/5.0 (Macintosh; Intel Mac OS X 10_15_2) AppleWebKit/537.36 (KHTML, like Gecko) Chrome/79.0.3945.117 Safari/537.36
@lvdv I’m not sure what’s going on. Try 0.34.2
Does this happen if you try to create a new dashboard?
What if you remove all the questions, can you then save?
Have you tried other browsers/computers?
Could it be a bad antivirus that is blocking something?
Or maybe you’re using CloudFlare or similar, that might be doing too much WAF?
Check the browser console Network-tab, when you try to save. It should give you details about the failing request - including errors and/or codes.
@flamber We’ve upgraded to 0.34.2. In both cases (a new dashboard and removing all the questions), saving worked. The bug only seems to appear when first trying to add a filter and trying to save without linking the filter with any card.
Are you using MySQL for the metadata by any chance? If so, then I know why it started working correctly in 0.34.2.
I have tried multiple different ways to get the “save failed”, but I cannot make it break - even when creating a filter without linking it.
I would really like to figure out what’s going on here, since this problem has been reported a couple of times, but I have never been able to reproduce it.
In either way, I’m glad it started working correctly for you.
Ironically enough, over the weekend a different dashboard that acquired the same issue. Weirdly enough no changes occurred in Metabase (our last update was on Friday) nor in the dashboard. We are using Redshift.
I cannot reproduce the error in other dashboards, but when it appears, my work around consists of editing the dashboard, removing the textbox, saving and than adding the textbox again.
@lvdv
Please post “Diagnostic Info” from Admin > Troubleshooting.
And do you see any error in the log, when you’re getting the “save failed”? Admin > Troubleshooting > Logs
There’s a couple of issues open about dashboard saving failed, but it might be different causes than your problem:
https://github.com/metabase/metabase/issues?utf8=✓&q=is%3Aissue+is%3Aopen+dashboard+“save+failed”
It’s been really difficult to get steps to reproduce the problem - and without a clear error log or steps to reproduce, then it’s really difficult to figure out what’s going wrong and fixing it.
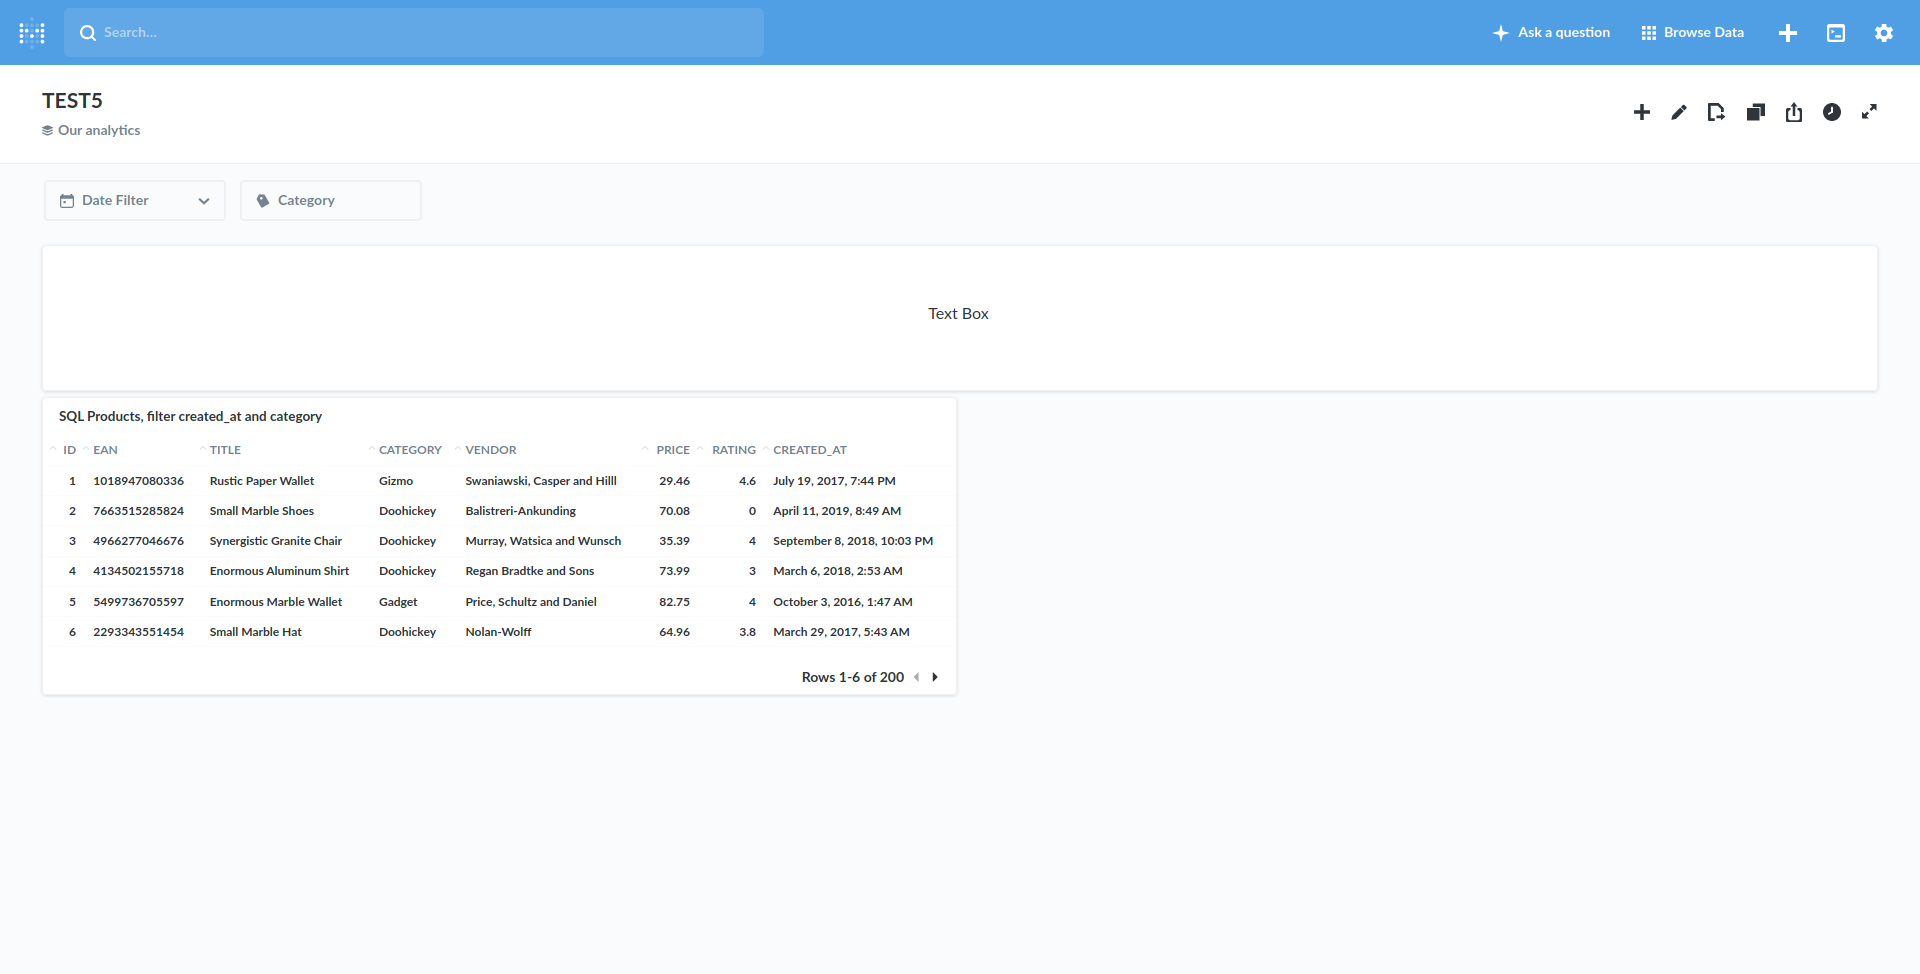
@lvdv I’m noticing that you have a Text Box as the first element, and there’s a filter. We’ve now figured out that it’s causing problems. Read more here: Dashboard filters javascript problem
@flamber Yup, that corresponds to what I am seeing with my dashboards. Thanks for the link.
Hi! I have the same problem!
My version is v0.34.3
If a remove all the text box, its works xD
@geovani Please post “Diagnostic Info” from Admin > Troubleshooting.
And can you post steps, so I could try to reproduce this using Sample Dataset?
Make sure that you don’t have empty titles on any of the charts (that issue will be fixed in 0.35.0)
Ok
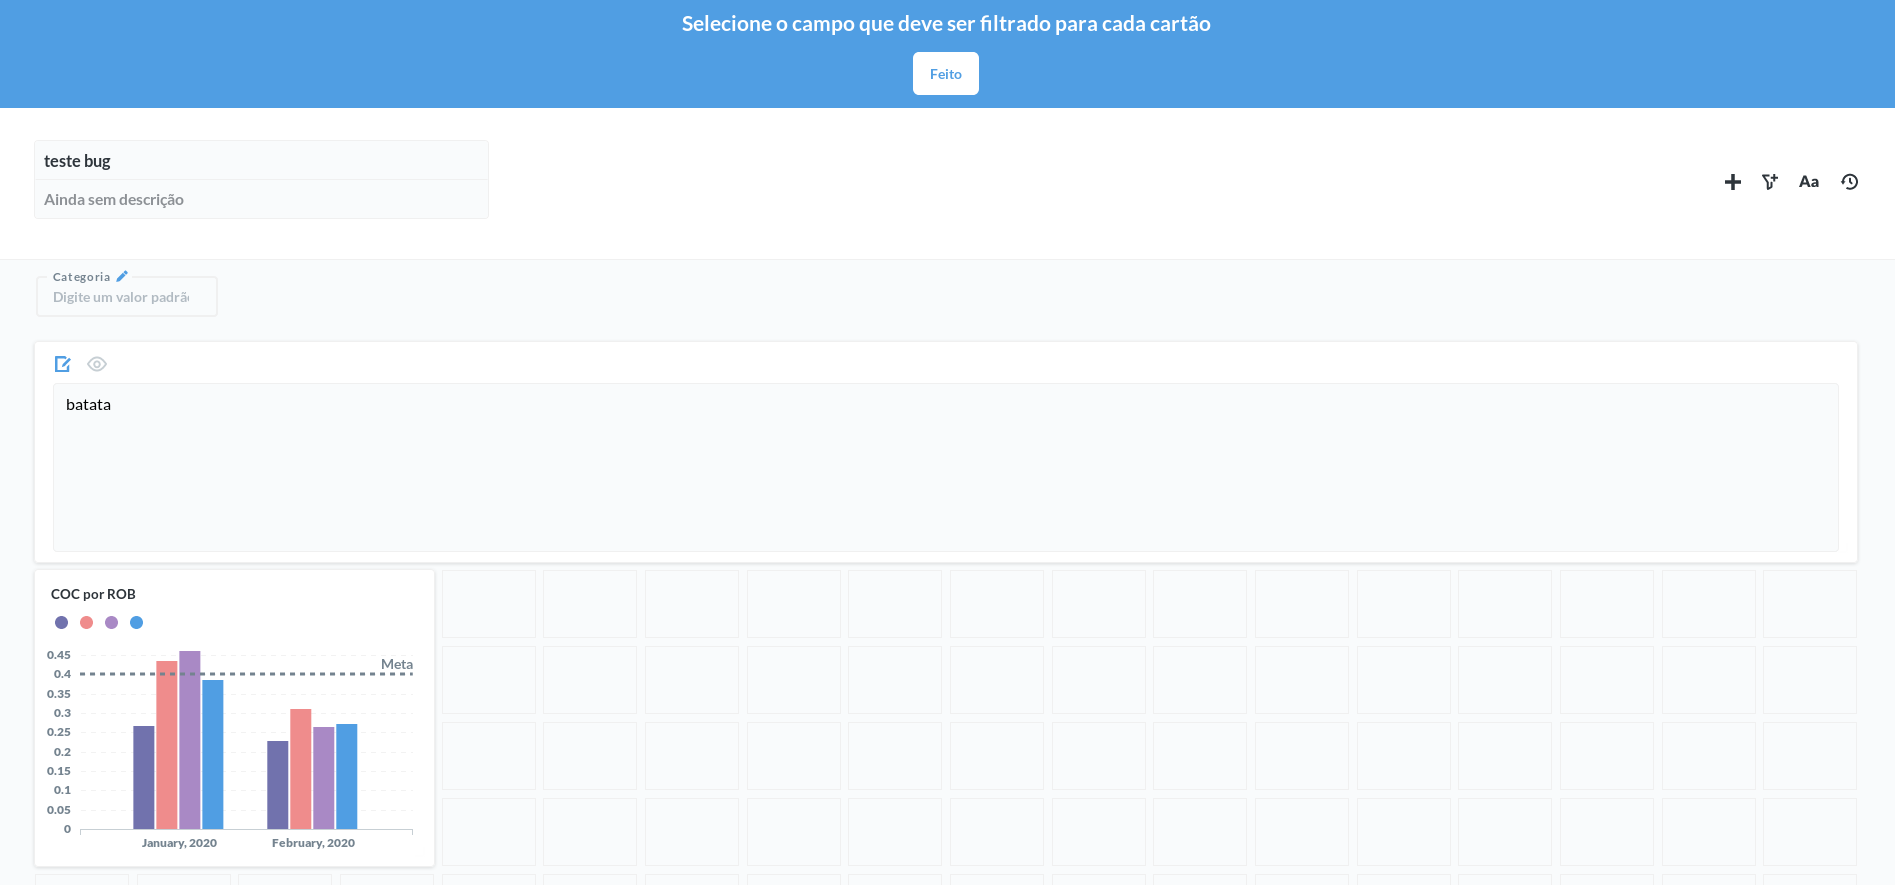
- Create new Dashboard
- Add a question with 2 filed filter: one its data e another is text (categorie)
- Add a Text Box On the begin of dashobar (like a title), fill all horizontal space
- Add a categorie Filter do dashboard.
And its break xD
{
“browser-info”: {
“language”: “pt-BR”,
“platform”: “Linux x86_64”,
“userAgent”: “Mozilla/5.0 (X11; Fedora; Linux x86_64; rv:70.0) Gecko/20100101 Firefox/70.0”,
“vendor”: “”
},
“system-info”: {
“java.runtime.name”: “OpenJDK Runtime Environment”,
“java.runtime.version”: “11.0.5+10”,
“java.vendor”: “AdoptOpenJDK”,
“java.vendor.url”: “https://adoptopenjdk.net/”,
“java.version”: “11.0.5”,
“java.vm.name”: “OpenJDK 64-Bit Server VM”,
“java.vm.version”: “11.0.5+10”,
“os.name”: “Linux”,
“os.version”: “4.14.154-128.181.amzn2.x86_64”,
“user.language”: “en”,
“user.timezone”: “America/Sao_Paulo”
},
“metabase-info”: {
“databases”: [
“mongo”,
“googleanalytics”,
“mysql”,
“postgres”,
“h2”
],
“hosting-env”: “unknown”,
“application-database”: “postgres”,
“application-database-details”: {
“database”: {
“name”: “PostgreSQL”,
“version”: “9.6.11”
},
“jdbc-driver”: {
“name”: “PostgreSQL JDBC Driver”,
“version”: “42.2.8”
}
},
“run-mode”: “prod”,
“version”: {
“date”: “2020-02-25”,
“tag”: “v0.34.3”,
“branch”: “release-0.34.x”,
“hash”: “1a83edb”
},
“settings”: {
“report-timezone”: “UTC”
}
}
}
@geovani I have not been able to reproduce the problem on 0.34.3. I've tested with a Simple question and Native/SQL. With the SQL question, I'm using Field Filters. This is what I have tested with:
You can "link’ you dashboard filter with the question?
@geovani Yes, I can link the filter to the question and save the dashboard.
Do you see any errors in your browser developer console or Admin > Troubleshooting > Logs?

Log do not show me nothing =/
But, when a Open my dashboard, its show this error on console
And, when I try add the filter, this error:
@geovani It’s the exact same errors, as I reported in the issue. But I cannot reproduce it anymore:
https://github.com/metabase/metabase/issues/11927
Are you using some type of CDN cache or anything like that?
Have you tried with Incognito/PrivateBrowsing-mode in your browser?
Can you reproduce the problem with Sample Dataset? Or is specific to something that I haven’t tested perhaps?
1 Like